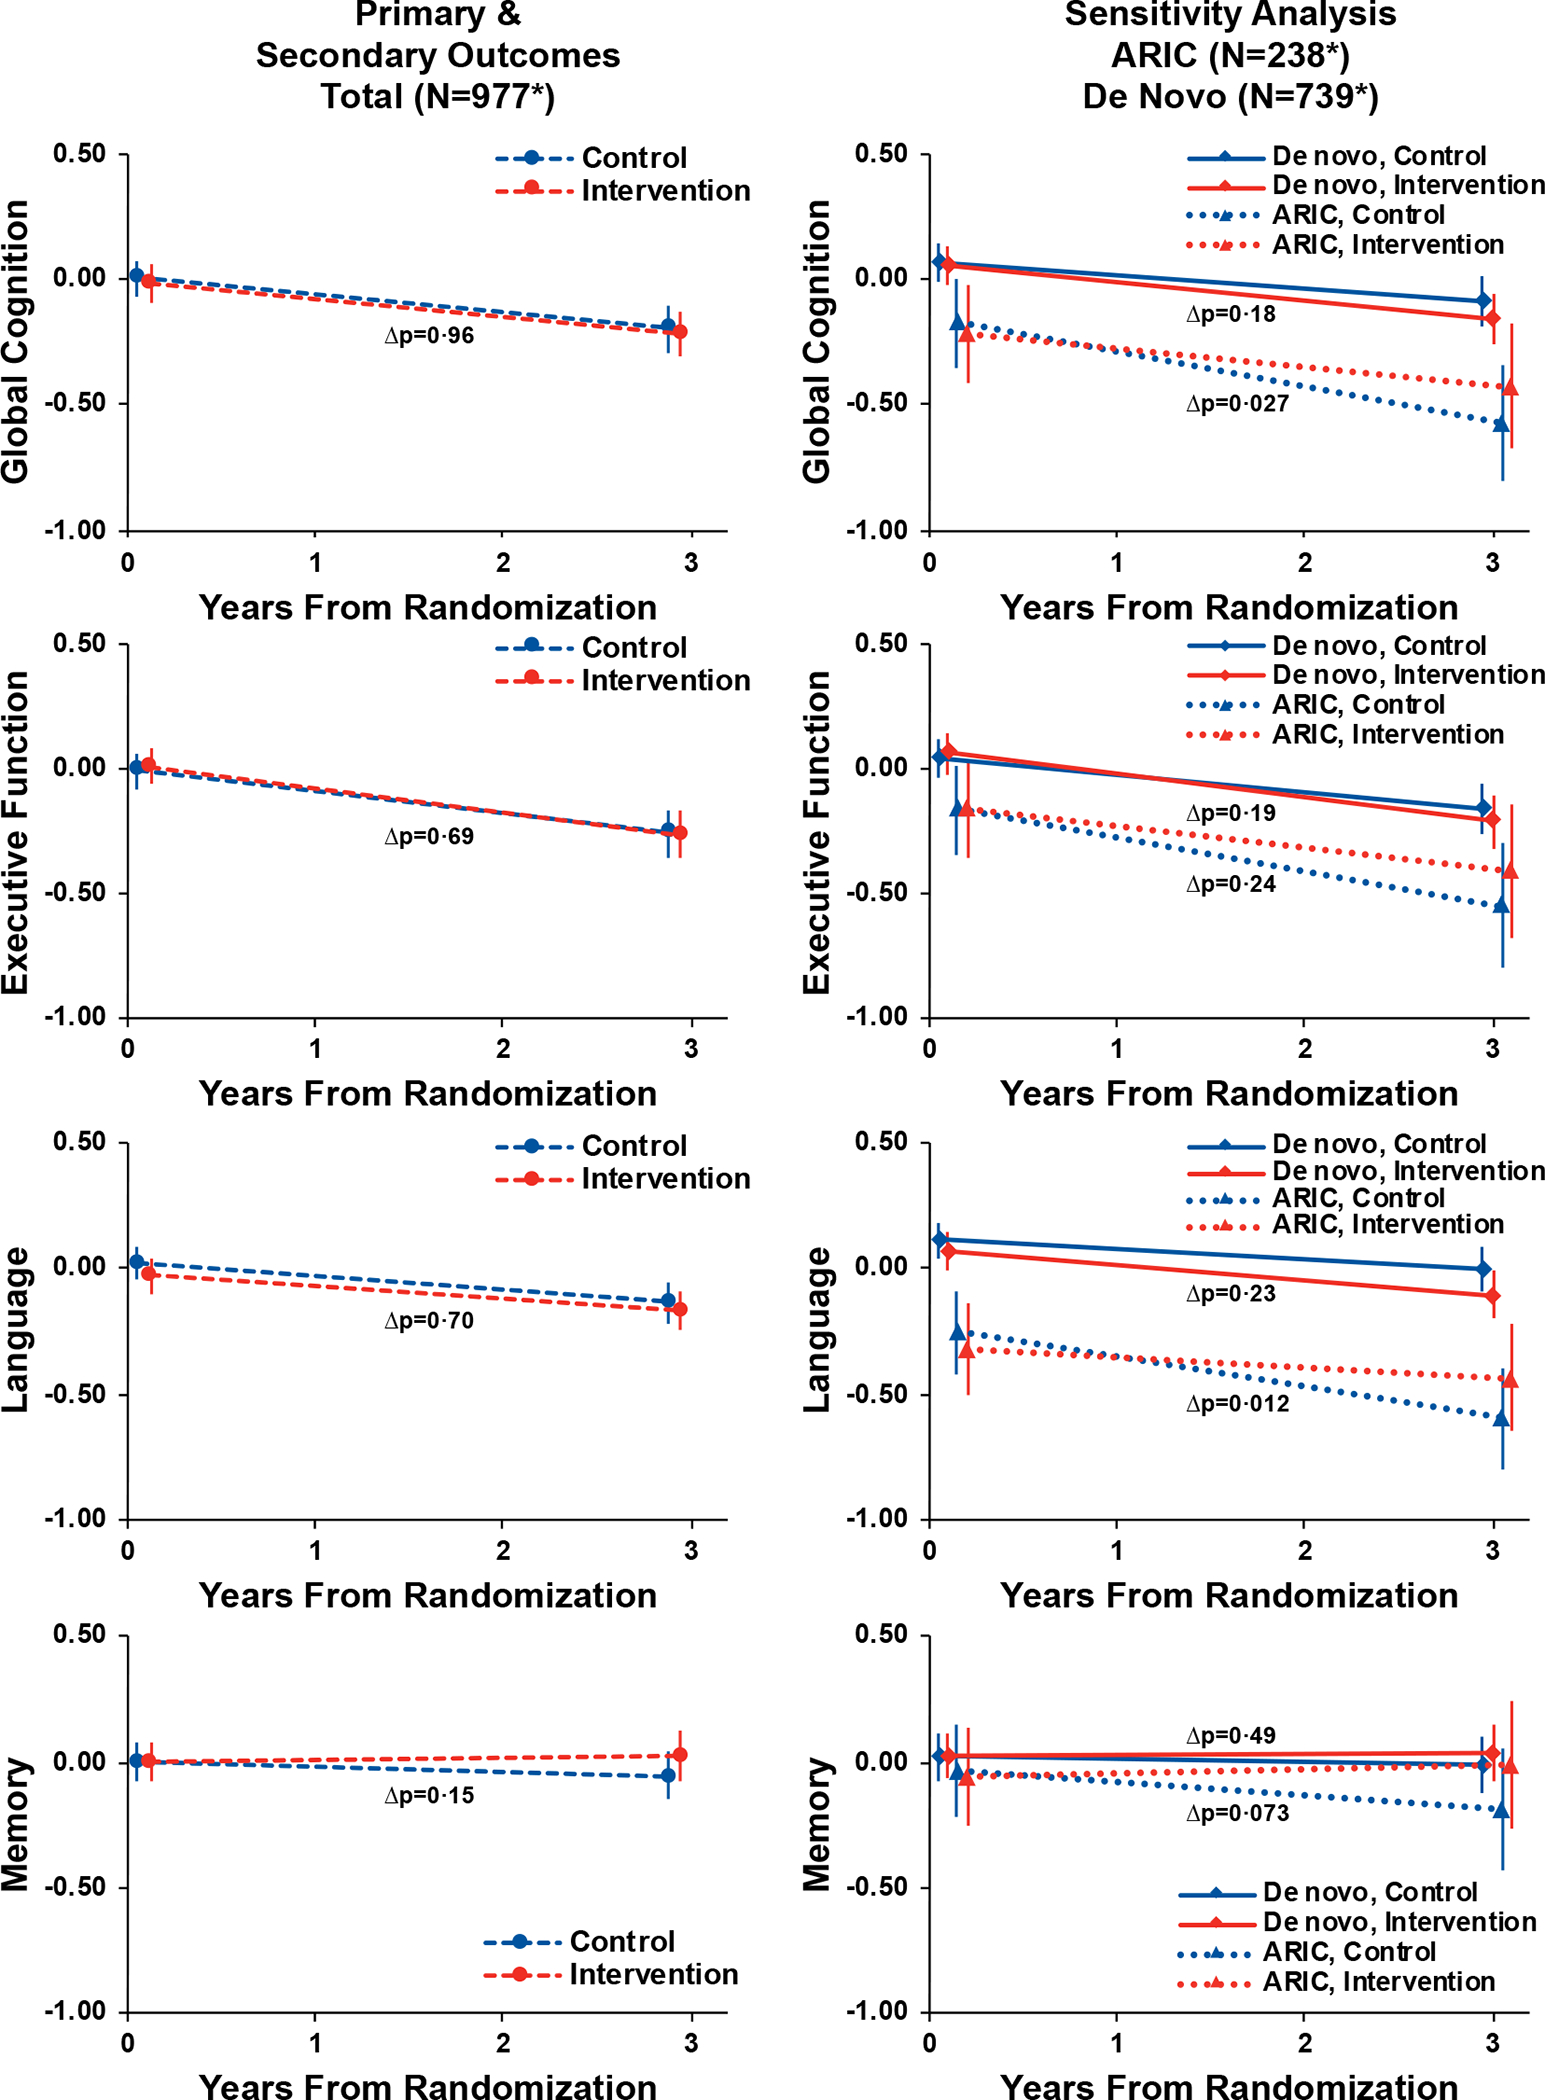
Figure 3.

Trajectories and Pointwise Estimates of Cognitive Function by Randomised Treatment Assignment Among the Total Cohort and Stratified by Recruitment Source (N=977)
Symbols: *The analytic sample for the primary analysis comprised 977 in-person assessments from baseline, 862 in-person assessments from year 3 (203 ARIC, 659 De Novo), 9 in-person assessments (5 ARIC, 4 De Novo) from participants who died prior to year 3 but completed an assessment less than a year before death, and 106 missing year 3 assessments (30 ARIC, 76 De Novo) with values generated from a prespecified multiple imputation model. Abbreviations: ACHIEVE, Aging and Cognitive Health Evaluation in Elders; ARIC, Atherosclerosis Risk in Communities. Y-axis values are cognitive factor scores that were developed using a validated latent variable modeling approach15 and standardized to the baseline with higher scores indicating better cognitive function. Parameter estimates, 95% confidence intervals, and p-values were calculated from a linear mixed effects models that adjusted for hearing loss (PTA <40 dB vs 40+ dB), recruitment source, field site, age, sex, education, and the presence of APOE e4 alleles at baseline. An interaction with time was specified for each covariate except education. Visualization based on a hypothetical participant whose characteristics equalled the sample means. Δp refers to the p-value of the interaction between time and randomisation.
