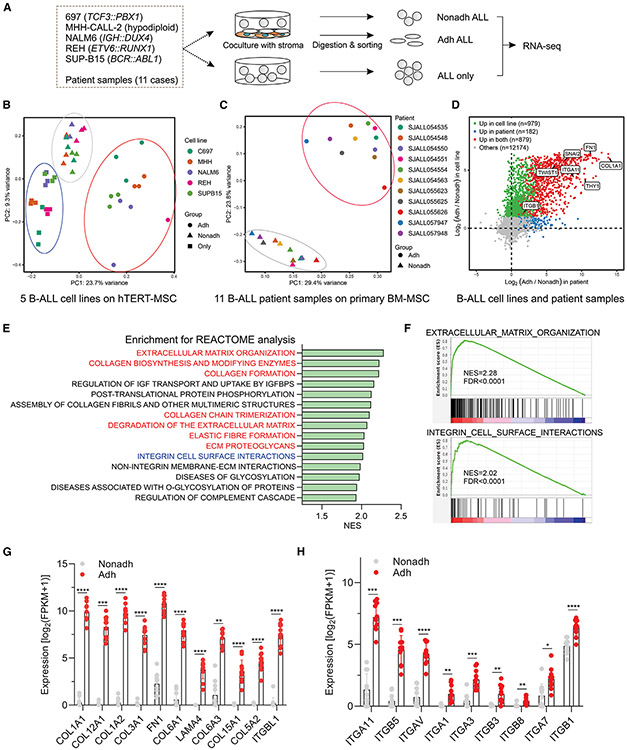
Figure 1. Enrichment of genes encoding cell adhesion molecules and extracellular matrix proteins in adherent ALL cells.
(A) Schema of ex vivo co-culture of ALL with MSCs. Five B-ALL cell lines and 11 B-ALL patient samples were co-cultured with hTERT-MSCs and primary MSCs, respectively. The RNA isolated from ALL-only, Adh ALL, and Nonadh ALL cells was subjected to RNA-seq.
(B) PCA plot for five ALL cell lines.
(C) PCA plot for 11 primary B-ALLs.
(D) Common DEGs in both cell lines and primary patient samples.
(E) Pathway analysis of the upregulated DEGs in Adh ALL was performed by using the Reactome database. NES, normalized enrichment score. Red color, ECM-associated pathways. Blue color, integrin-associated pathway.
(F) Enrichment plots of integrin cell surface and reactome extracellular matrix organization pathways. FDR, false discovery rate.
(G) Enriched integrin family genes in 11 patient Adh ALL samples compared to Nonadh ALL samples (false discovery rate [FDR] < 0.05). Dots, individual value. Bar, mean with SD.
(H) Enriched ECM genes in 11 patient Adh ALL samples compared to Nonadh ALL samples (FDR < 0.05). Dots, individual value. Bar, mean with SD. Statistical testing was performed using two-tailed Student’s t test, ****p < 0.0001, ***p < 0.0005, **p < 0.005, *p < 0.05. See also Figure S1.

