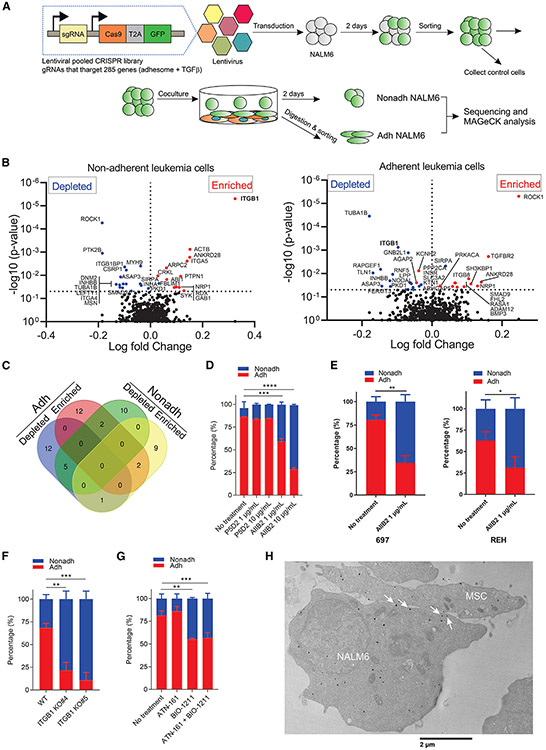
Figure 3. Identification of integrin beta 1 in ALL cells mediating the adhesion to MSCs.
(A) Functional CRISPR-Cas9 library screening of cell adhesion genes implicated in adhesion of ALL cells to MSCs. NALM6 cells transduced with lentivirus expressing Cas9 and gRNAs that target 285 genes, adhesome (232 genes) and TGFβ pathway (53 genes), were co-cultured with MSCs, and then Nonadh and Adh NALM6 cells were collected for sequencing and MAGeCK analysis.
(B) Volcano plots displaying the log fold change on the X axis and −log10 p value in Y axis for all sgRNAs identified in Nonadh NALM6 (left panel) and Adh NALM6 (right panel).
(C) Venn diagram showing number of genes that are either depleted or enriched genes in both Nonadh and Adh NALM6.
(D) Cell adhesion assay of NALM6 cells to MSCs in the presence of P5D2 or AIIB2 (n = 3). Data, mean ± SD.
(E) Cell adhesion assay of 697 and REH to MSCs in the presence of AIIB2 (n = 3). Data, mean ± SD.
(F) Cell adhesion assay of ITGB1 KO NALM6 clones to MSCs (n = 3). Data, mean ± SD.
(G) Cell adhesion assay of NALM6 cells to MSCs in the presence of blocker of either 25 μM ATN-161 or BIO-1211 (n = 3). Data, mean ± SD.
(H) TEM of integrin β1 in NALM6 co-cultured with MSCs. White arrows, integrin β1 localized at the synapse between NALM6 and MSCs. Scale bars represent 2 μm. Student’s t test compared to WT or no treatment of Adh leukemic cells, ****p < 0.0001, ***p < 0.0005, **p < 0.005, *p < 0.05. See also Figure S2.

