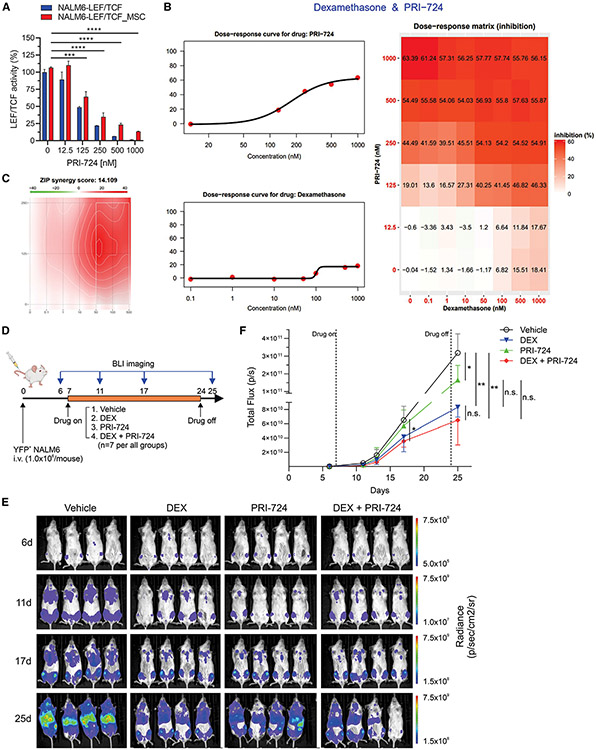
Figure 7. Targeting of β-catenin-CBP interaction reduces leukemic burden of B-ALL mouse model and inhibits the viability of B-ALL PDX cells co-cultured with MSCs.
(A) Inhibition of β-catenin-mediated transcriptional activity by PRI-724 (n = 3). Data, mean ± SD. Statistical testing was performed using two-tailed Student’s t test; ****p < 0.0001 and ***p < 0.0005.
(B) Dose-response matrix (inhibition) for PRI-724 and DEX in YFP-positive NALM6 cells co-cultured with MSCs. The left two graphs show dose-response curves for PRI-724 (upper) and DEX (lower). Y axis shows the inhibition rate. The right graph shows drug response of combination of both drugs. Inhibition scores are analyzed by SynergyFinder 2.0.
(C) ZIP synergy score used for synergy score. Less than −10, antagonistic; from −10 to 10, additive; larger than 10, synergistic.
(D) Schematic of the NALM6 xenograft model. NSG mice were treated with vehicle, DEX (4 mg/L), PRI-723 (40 mg/kg), or combination of both drugs on day 7 and stopped at day 24. Leukemic burdens were analyzed by BLI.
(E) BLI images of day 6, 11, 17, and 25. (n = 7 per group).
(F) Quantification of the total flux (p/s) of BLI. Data, mean ± SD. Statistical testing was performed using two-way ANOVA with Tukey’s multiple comparisons test, **p < 0.005, *p < 0.05. See also Figure S7.

