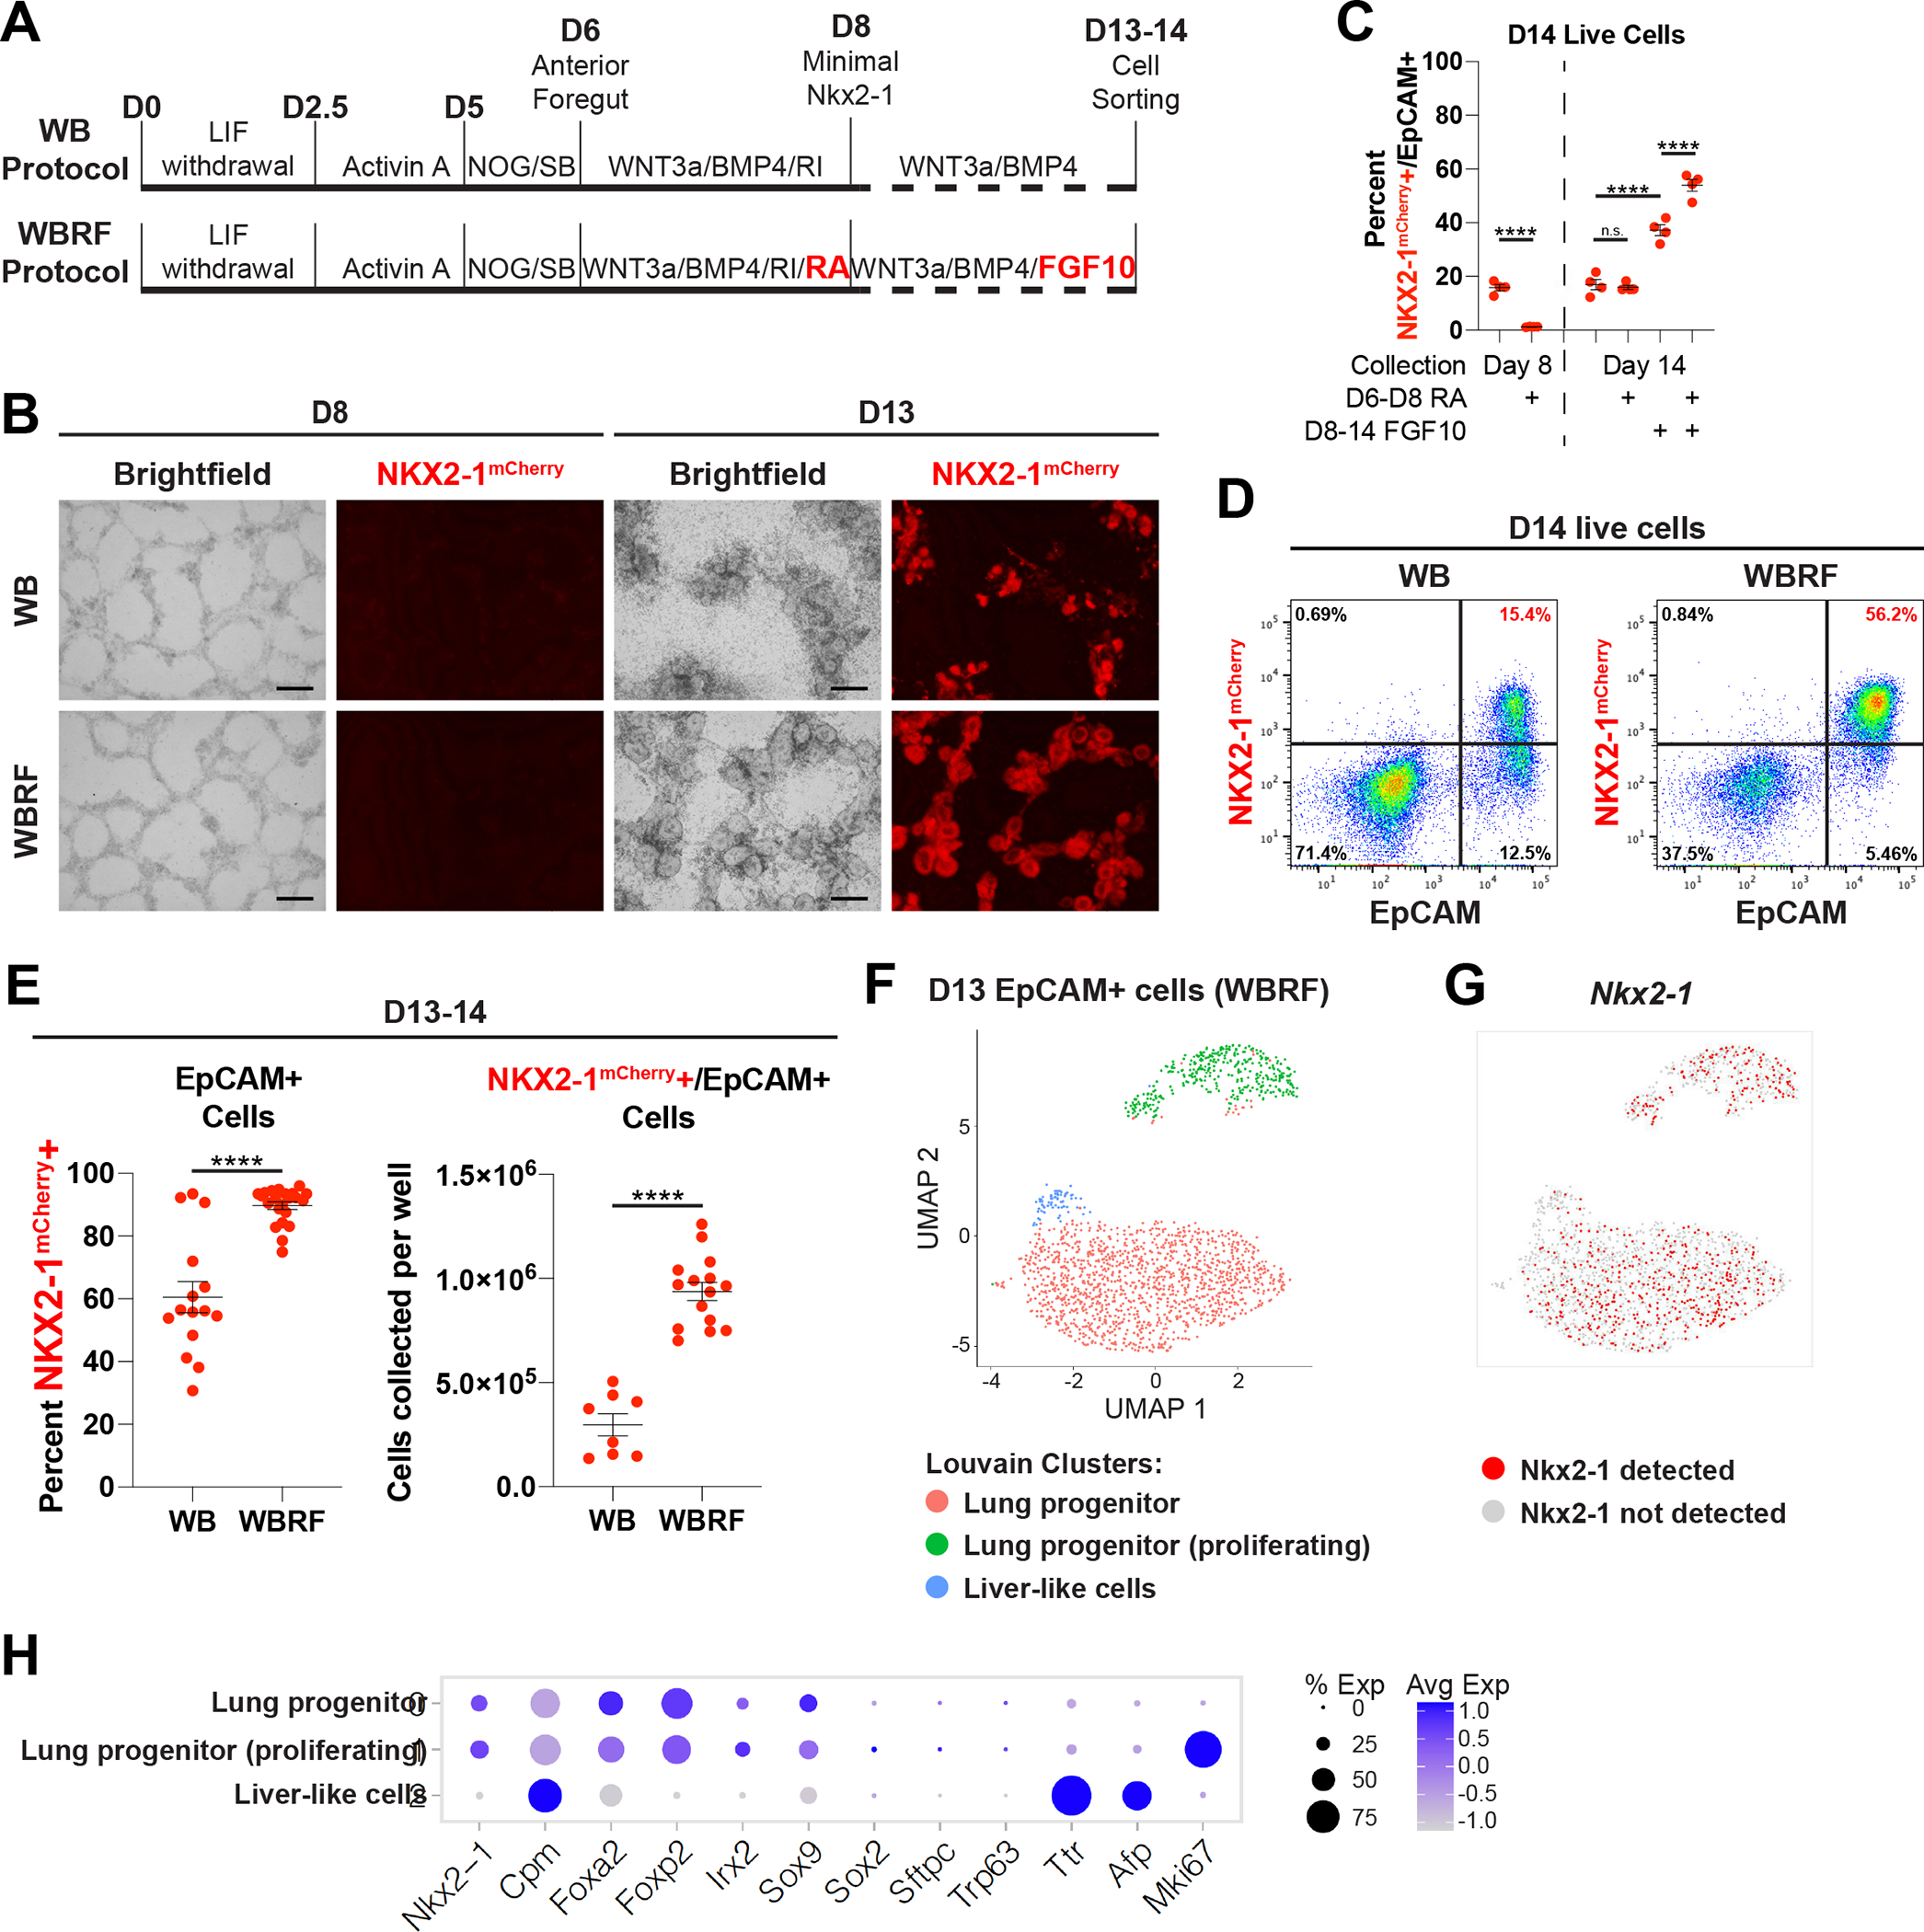
Figure 1: Modified Lung Specification Protocol Leads to Increased Yield of Lung Progenitors.

(A) Schematic of WB and WBRF lung specification protocols for directed differentiation of mouse ESCs carrying an Nkx2–1mCherry reporter.
(B) Fluorescent microcopy images of day 8 and 13 of WB and WBRF lung specification protocols. Scale bars are 200um.
(C) Quantification of the percent of live cells that are NKX2–1mCherry+/EpCAM+ double positive lung epithelial progenitors on day 8 or day 14 depending on the inclusion of RA and/or FGF10. n.s. not significant, **** p < 0.0001 by one-way ANOVA. n=4 biological replicates. Error bars = mean +/− SEM.
(D) FACS plots on day 14 of WB and WBRF lung specification protocols.
(E) Quantification of the percent of epithelial cells that are NKX2–1mCherry+ and the yield of NKX2–1mCherry+/EpCAM+ cells per well of a 6-well plate on day 13–14 of lung specification protocols. **** p < 0.0001 by unpaired, two-tailed Student’s t-test. n=15, 22, 8, 15 biological replicates. Error bars = mean +/− SEM.
(F) UMAP plot for scRNA-seq of Epcam+ sorted day 13 cells from WBRF lung specification protocol. Plot displays three clusters identified by Louvain clustering.
(G) UMAP plot displaying presence or absence of detectable Nkx2–1 in these same day 13 cells.
(H) Expression of pulmonary and liver genes in annotated clusters of scRNA-seq data set.
