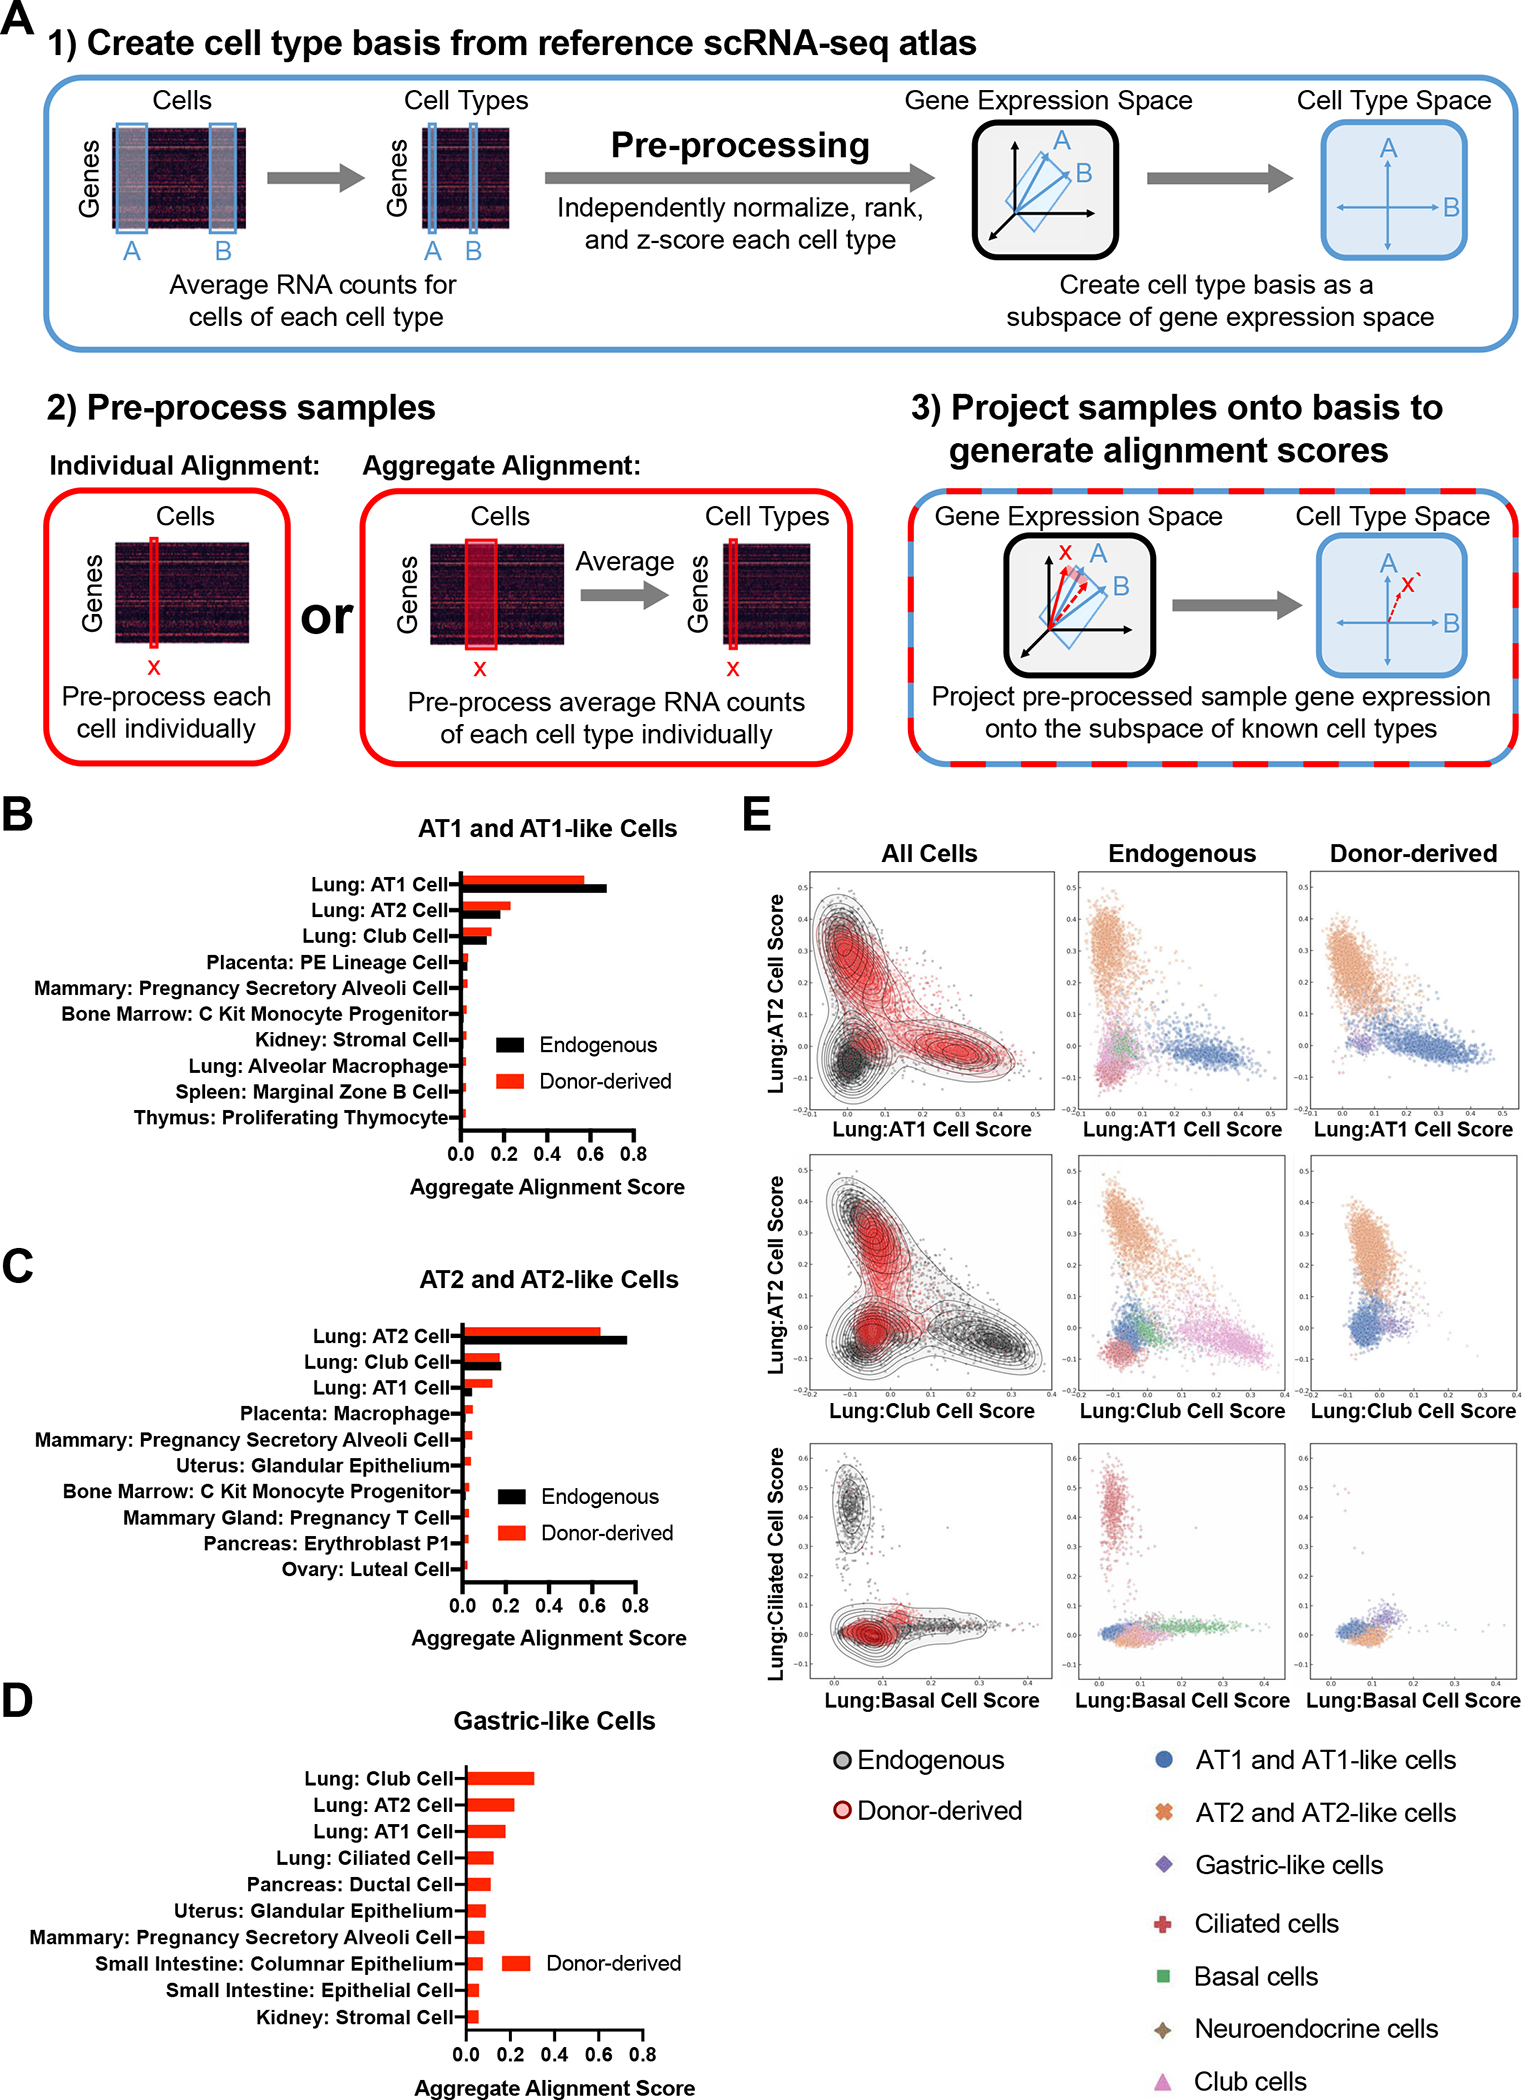
Figure 6: Global Transcriptomic Comparison of Endogenous and Donor-derived Lung Epithelial Cells using scTOP.

(A) Schematic of scTOP (Single-Cell Type Order Parameters).
(B) The top ten aggregate alignment scores for donor-derived AT1-like cells and the corresponding scores for endogenous AT1 cells. All reference cell types are from adult mice (Mouse Cell Atlas or Control sample as delineated in Figure 4) 51.
(C) The top ten aggregate alignment scores for donor-derived AT2-like cells and the corresponding scores for endogenous AT2 cells. All reference cell types are from adult mice.
(D) The top ten aggregate alignment scores for donor-derived gastric-like cells. All reference cell types are from adult mice.
(E) Individual alignment scores for all donor-derived and endogenous epithelial cells against the indicated reference cells. Each cell is annotated (by color and shape shown in the key below the graphs) based on sample type or cell type as determined in Figure 4.
