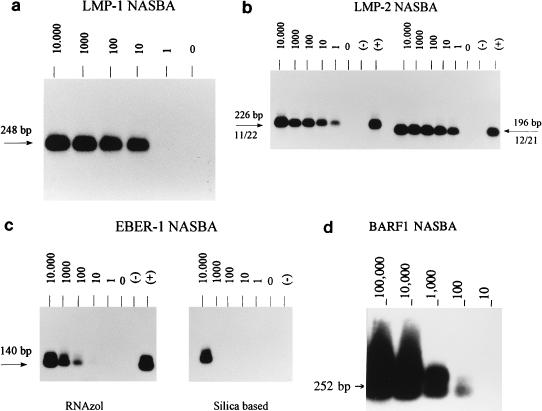
FIG. 3.
Relative sensitivities of the LMP1 (a), LMP2 (b) (left, primer set 1.1-2.2 [11/22]; right, primer set 1.2-2.1 [12/21]), and EBER (c) (left, RNAzol isolation; right, silica-based isolation) NASBAs and analytical sensitivity of the BARF1 NASBA (d). The relative sensitivity of the LMP1 and LMP2 NASBAs is 1 JY cell, and the analytical sensitivity of the BARF1 NASBA is 10 copies of cRNA; due to photographic reduction, these signals may not be visible. The relative sensitivity of the EBER NASBA after RNAzol isolation is 100 JY cells. The number of JY cells, and for BARF1, the number of cRNA copies, is indicated above each lane. +, positive control; −, negative control.

