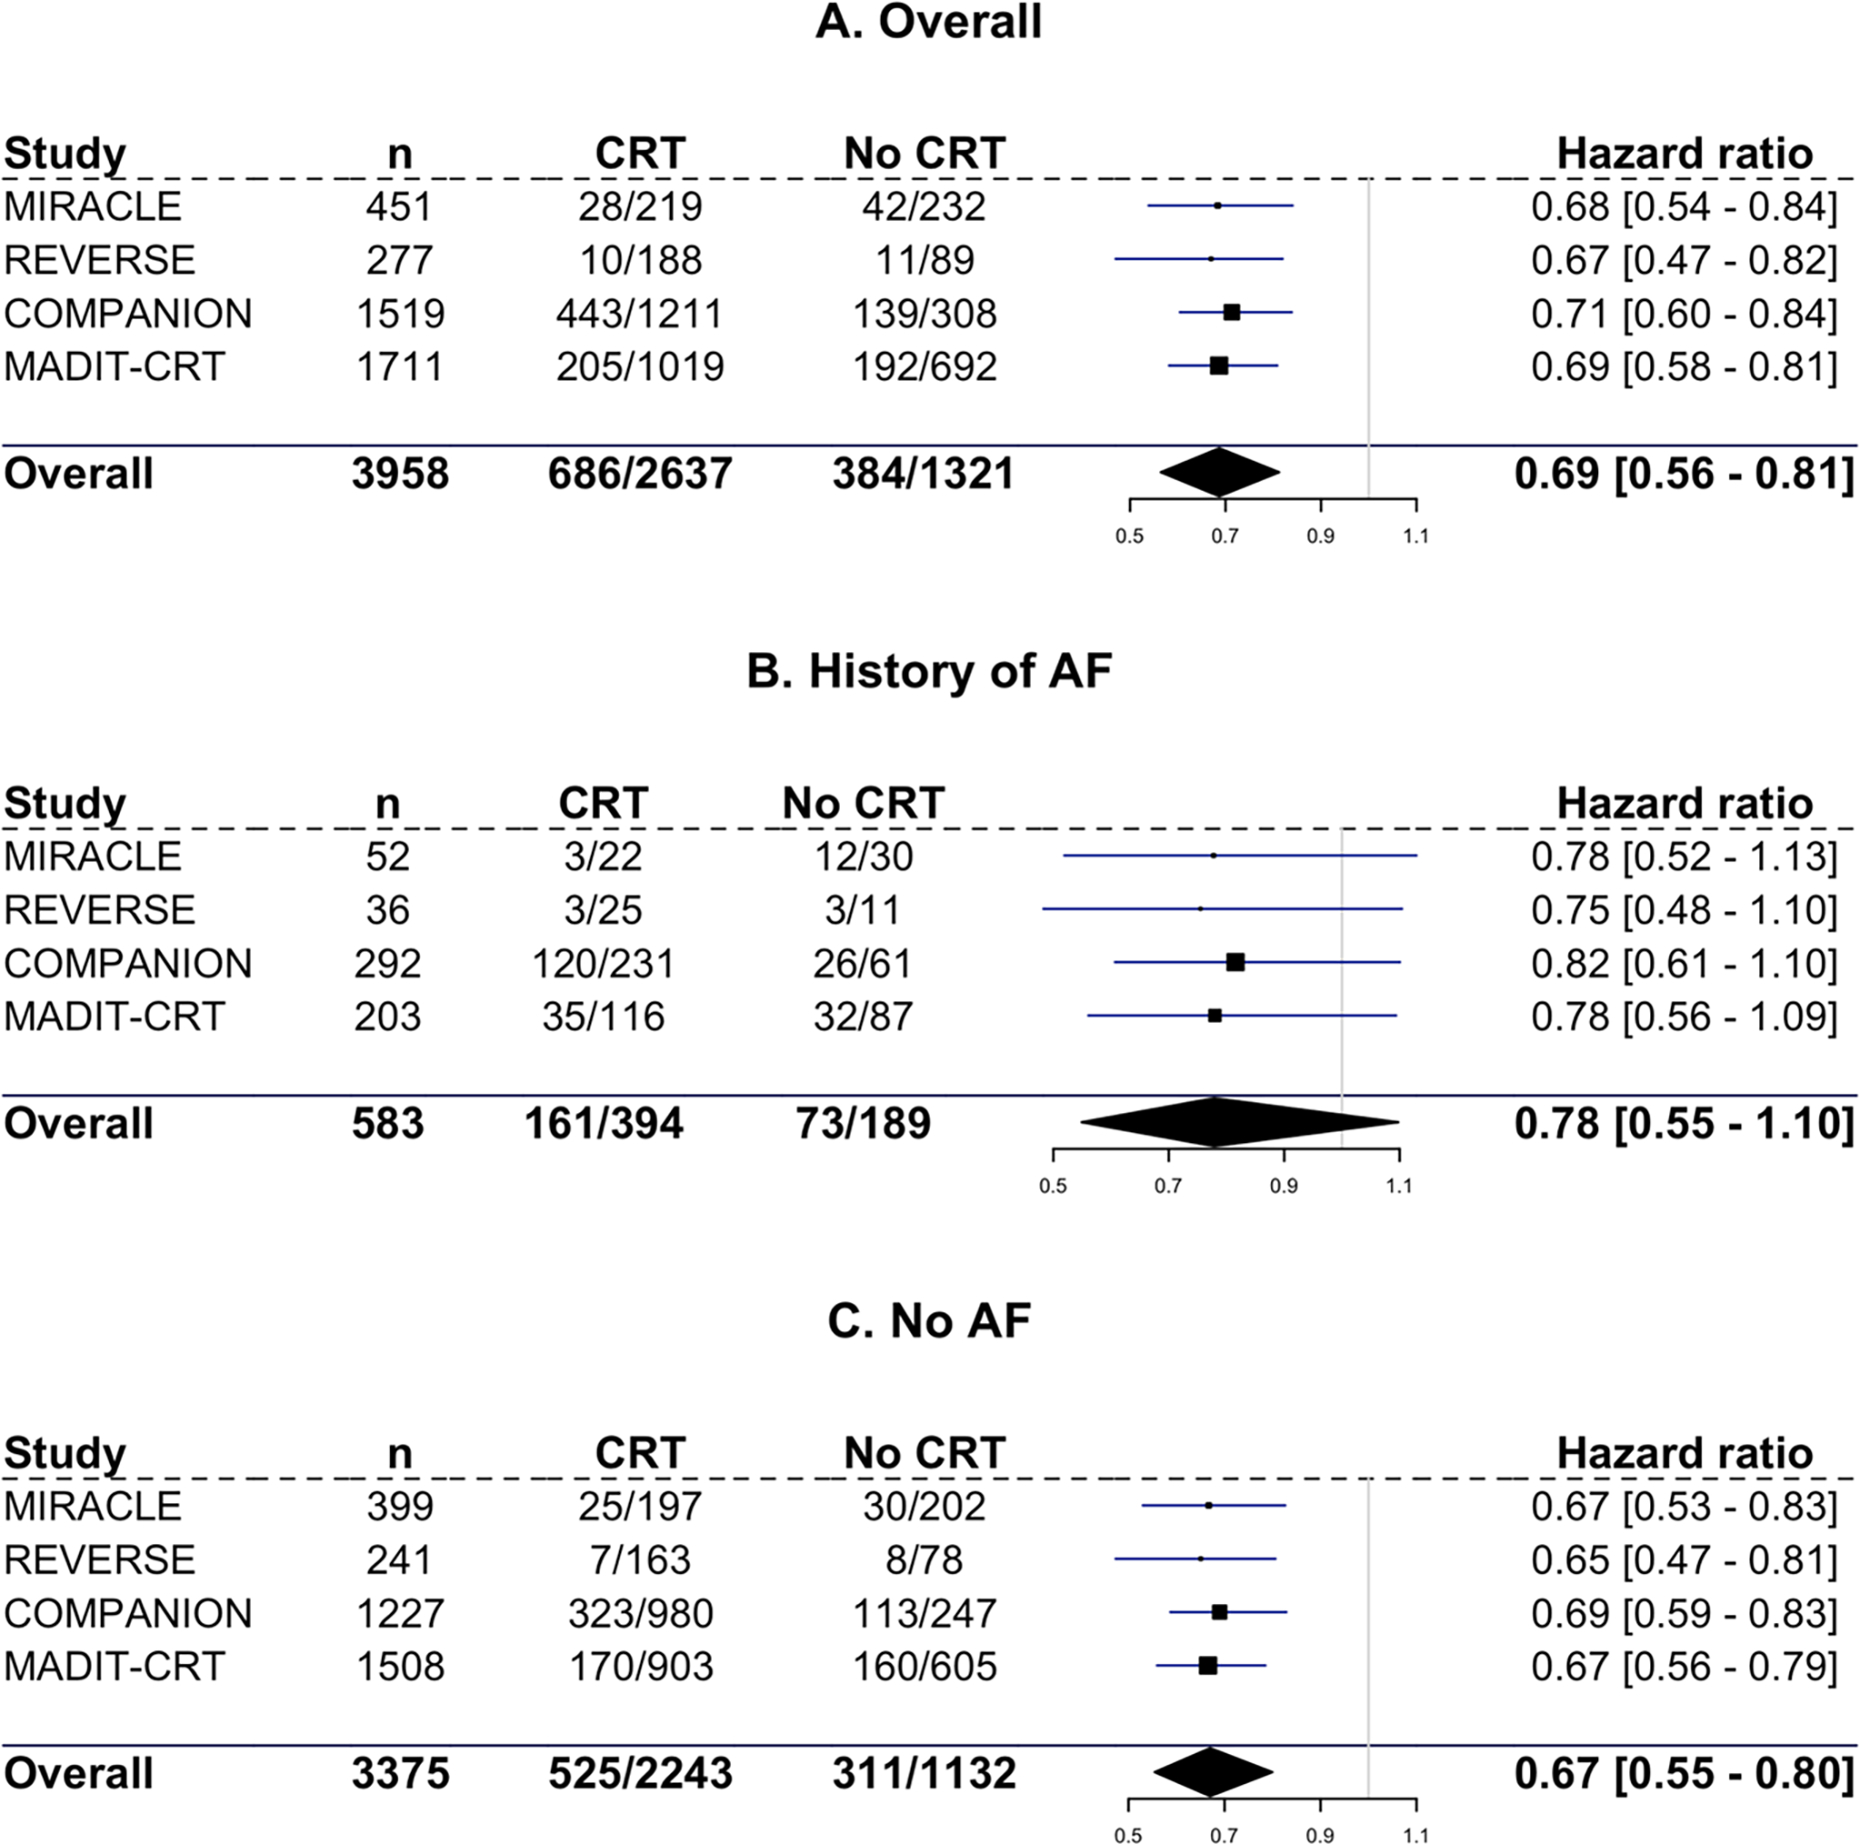
Figure 3. Forest plot for time to heart failure hospitalization or all-cause mortality.

Hazard ratios with 95% credible interval for heart failure hospitalization or all-cause mortality for all three subgroups and for each individual trial. A: overall population. B: Patients with a history of AF. C: Patients without AF.
