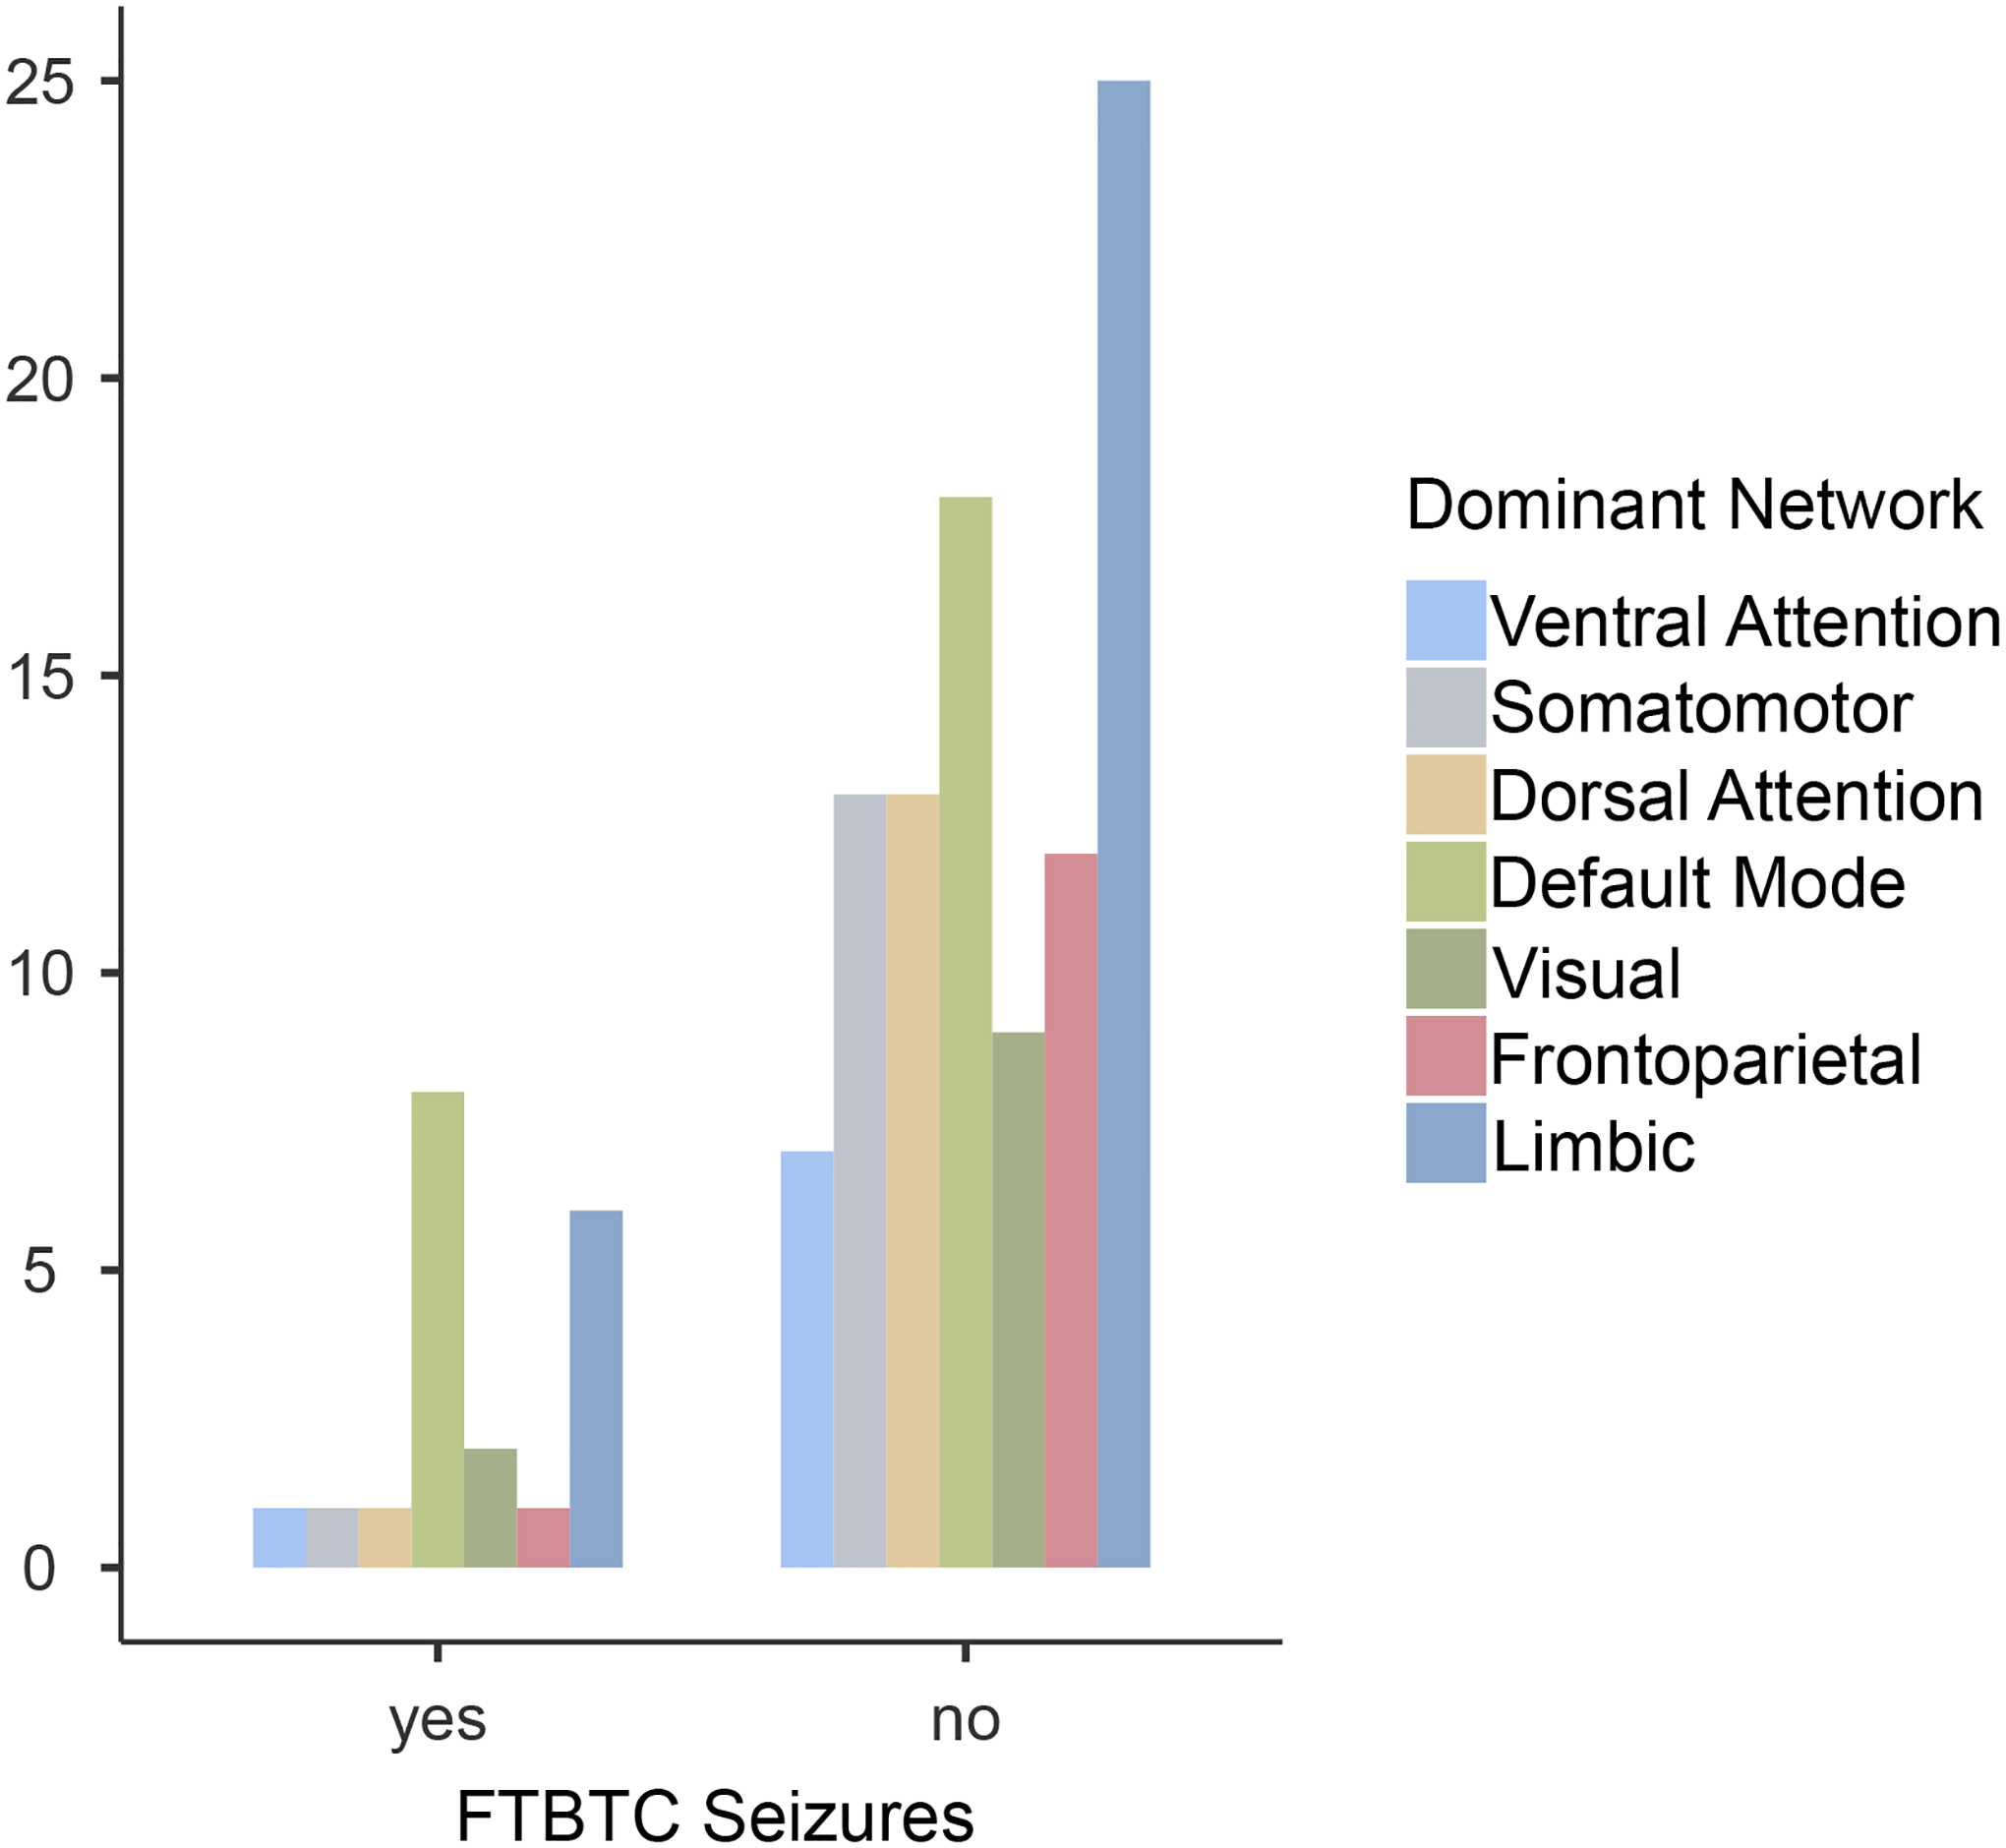
Figure 1:

FCD Dominant Network and the Presence of FTBTC Seizures
| Dominant Network | ||||||||
|---|---|---|---|---|---|---|---|---|
| FTBTC seizures | Ventral Attention | Somatomotor | Dorsal Attention | Default Mode | Visual | Frontoparietal | Limbic | Total |
| yes | 1 | 1 | 1 | 8 | 2 | 1 | 6 | 20 |
| no | 7 | 13 | 13 | 18 | 9 | 12 | 25 | 97 |
| Total | 8 | 14 | 14 | 26 | 11 | 13 | 31 | 117 |
