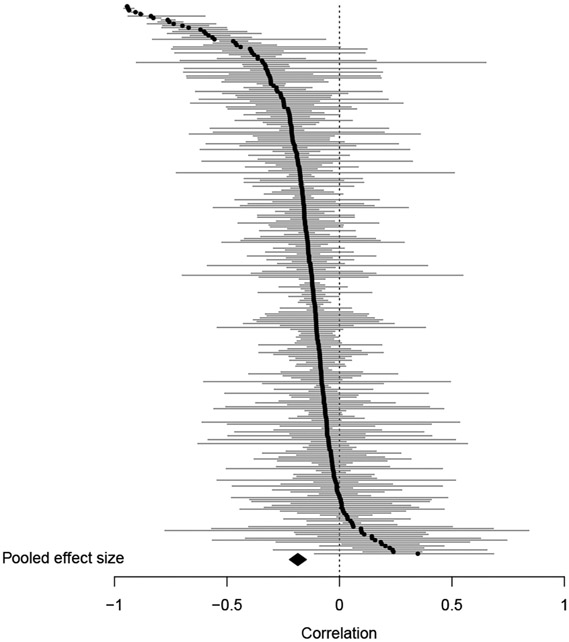
Figure 2. Caterpillar plot of corrected correlations from cross-sectional samples.
The black dots and the gray horizontal lines are effect sizes and 95% confidence intervals from individual samples. The black diamond is the pooled correlation. The two influential cases were excluded from this plot. Correlations were corrected for the age range restriction to reduce the noise caused by the heterogeneity of age range across different samples.

