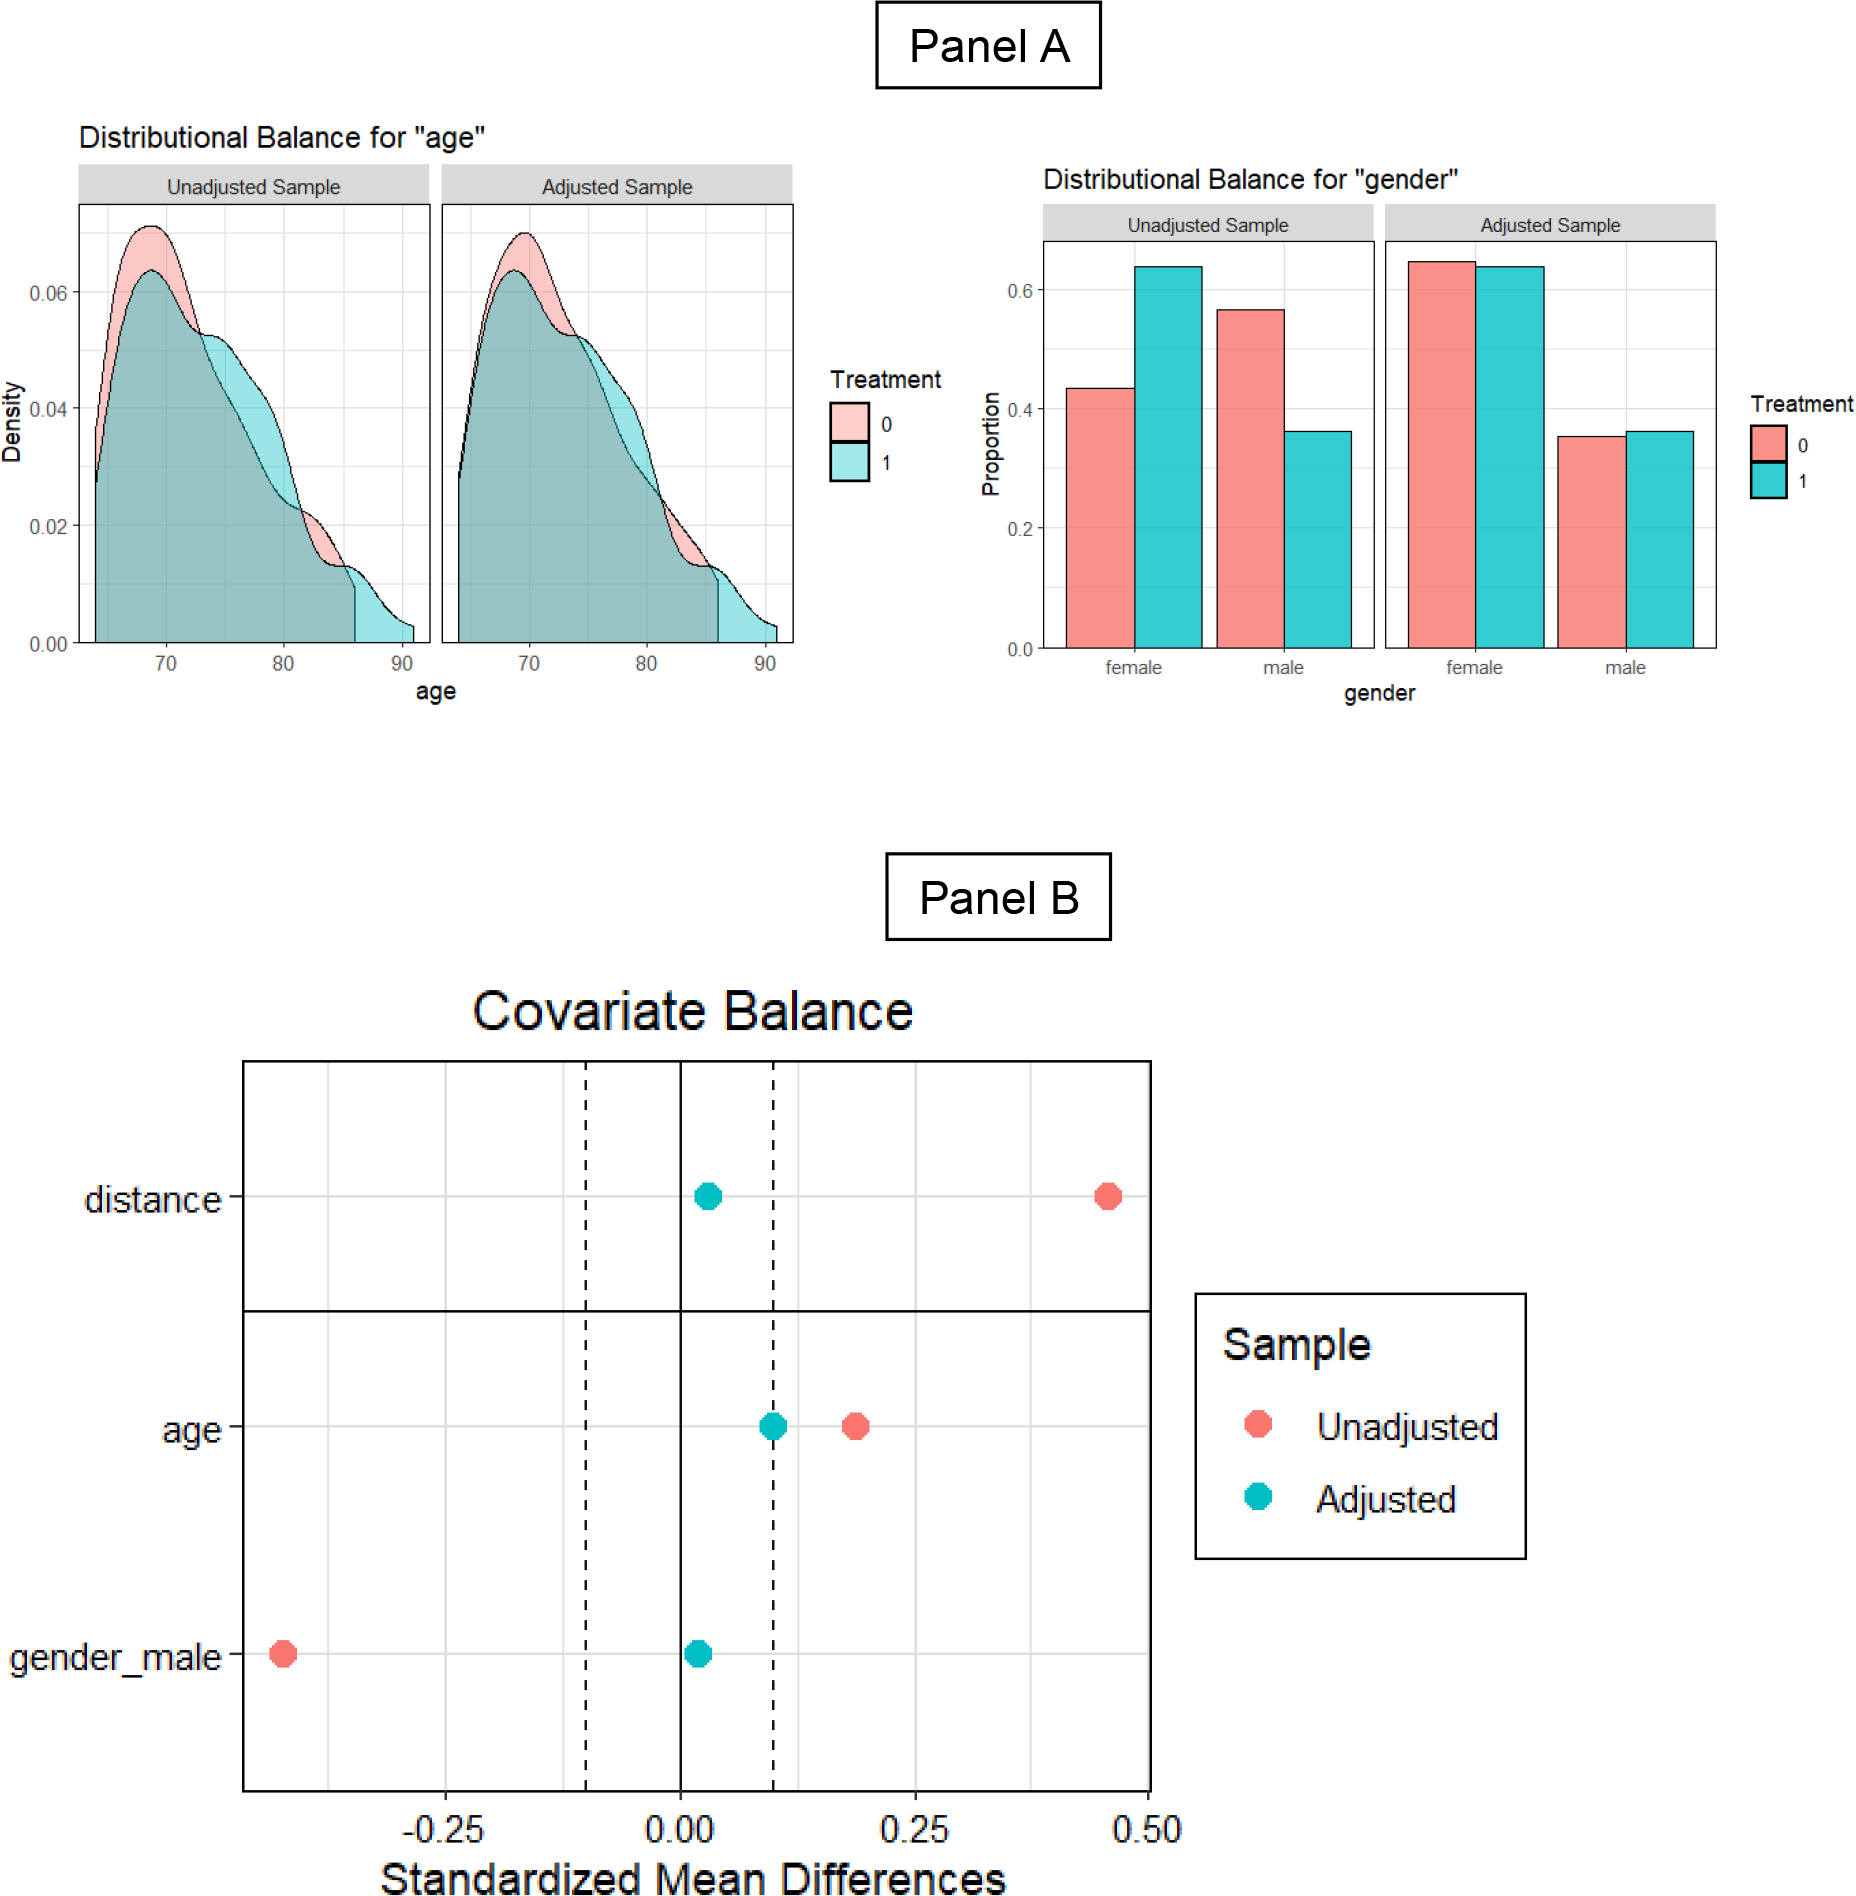
Figure 2.

Panel A contains the probability density plots of age and the proportion histograms of gender for the delirium and no delirium groups before and after the matching adjustment. Treatment in the legends depicts 1 = delirium group, and 0 = no delirium group. Panel B contains the plot of the standardized mean differences (SMDs) for the estimated propensity scores (distance) and the matching variables. The two dashed vertical lines correspond to SMD = 1 and −1. SMDs falling outside of the two lines indicate an imbalance for the variable.
