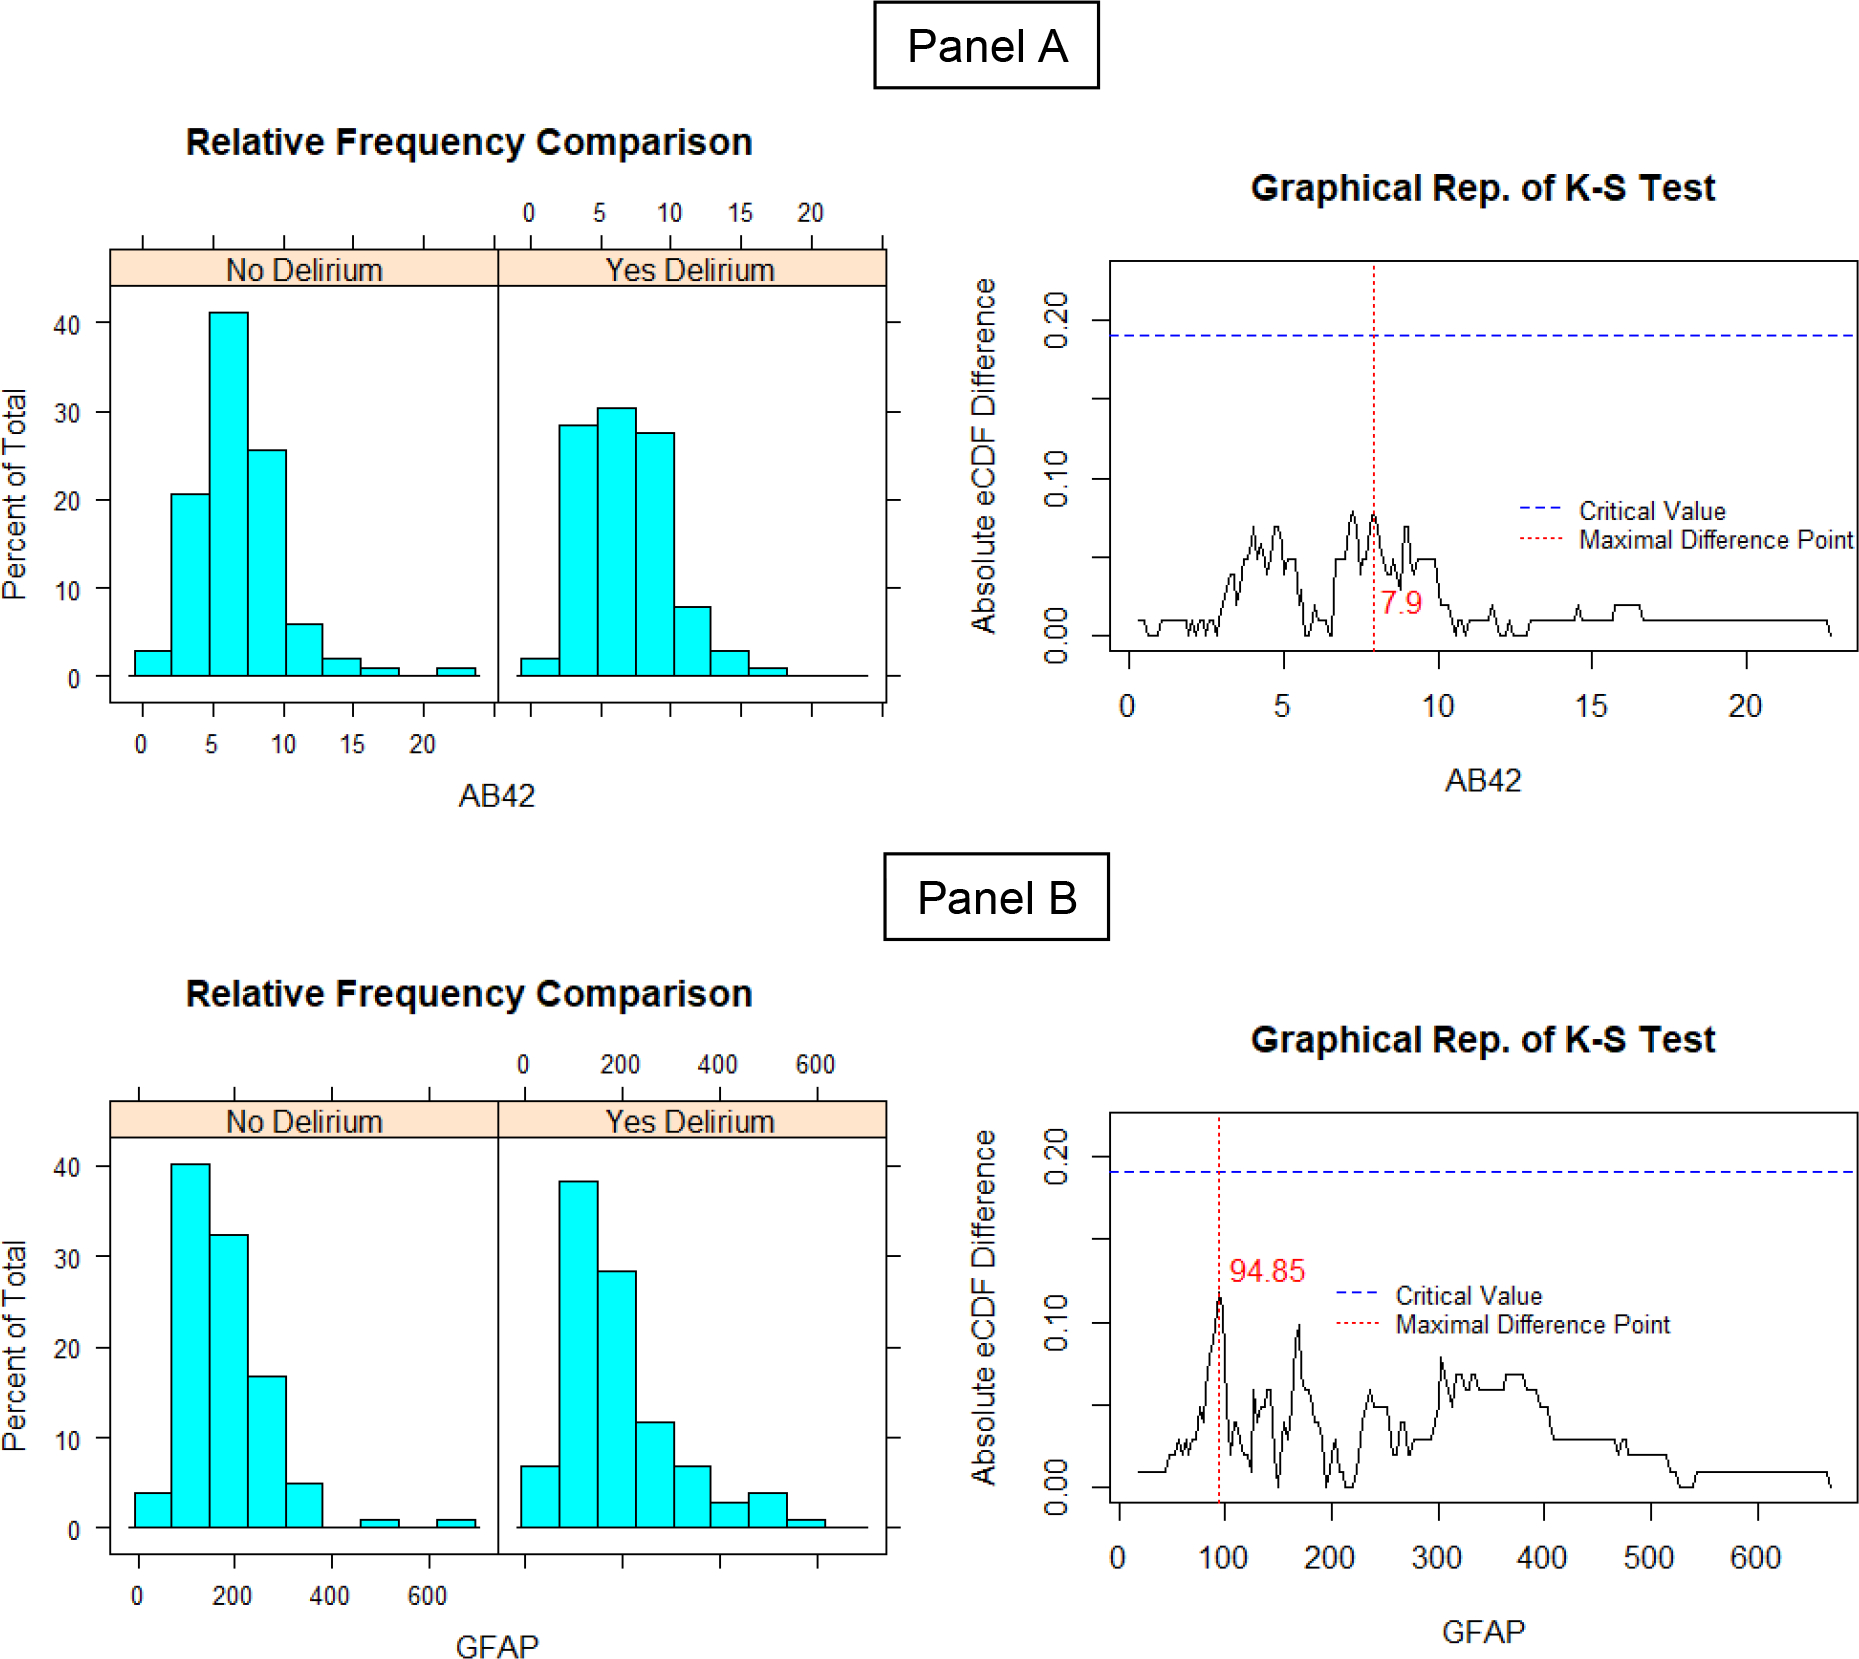
Figure 3.

The solid line is the difference between the two groups’ eCDF. The red vertical line is consistent with the point where the largest difference is also the location of the K-S test. The blue horizontal line stands for the critical value of the KS test.
