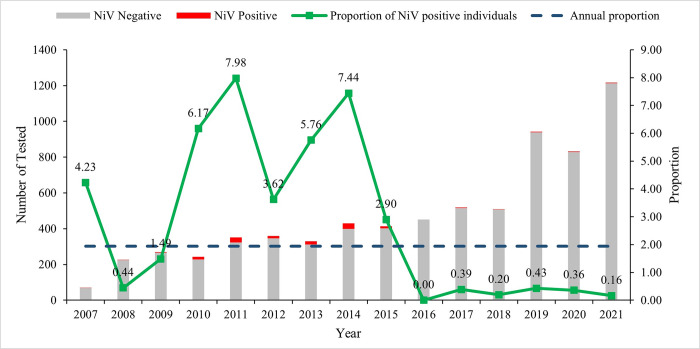
Fig 3. Distribution of individuals tested for NiV infection at ten sentinel hospitals in Bangladesh, January 2007 to December 2021.
The red bars represent the number of NiV-positive persons (n = 139), and the grey bars indicate the number of NiV-negative individuals (n = 7011). The small green squares signify the proportion (%) of Nipah cases detected in the calendar year. The horizontal dark blue line implies the overall annual proportion of 1.94%. * In 2007, active sites started reporting the total number of suspected Nipah encephalitis/pneumonitis cases admitted every month.

