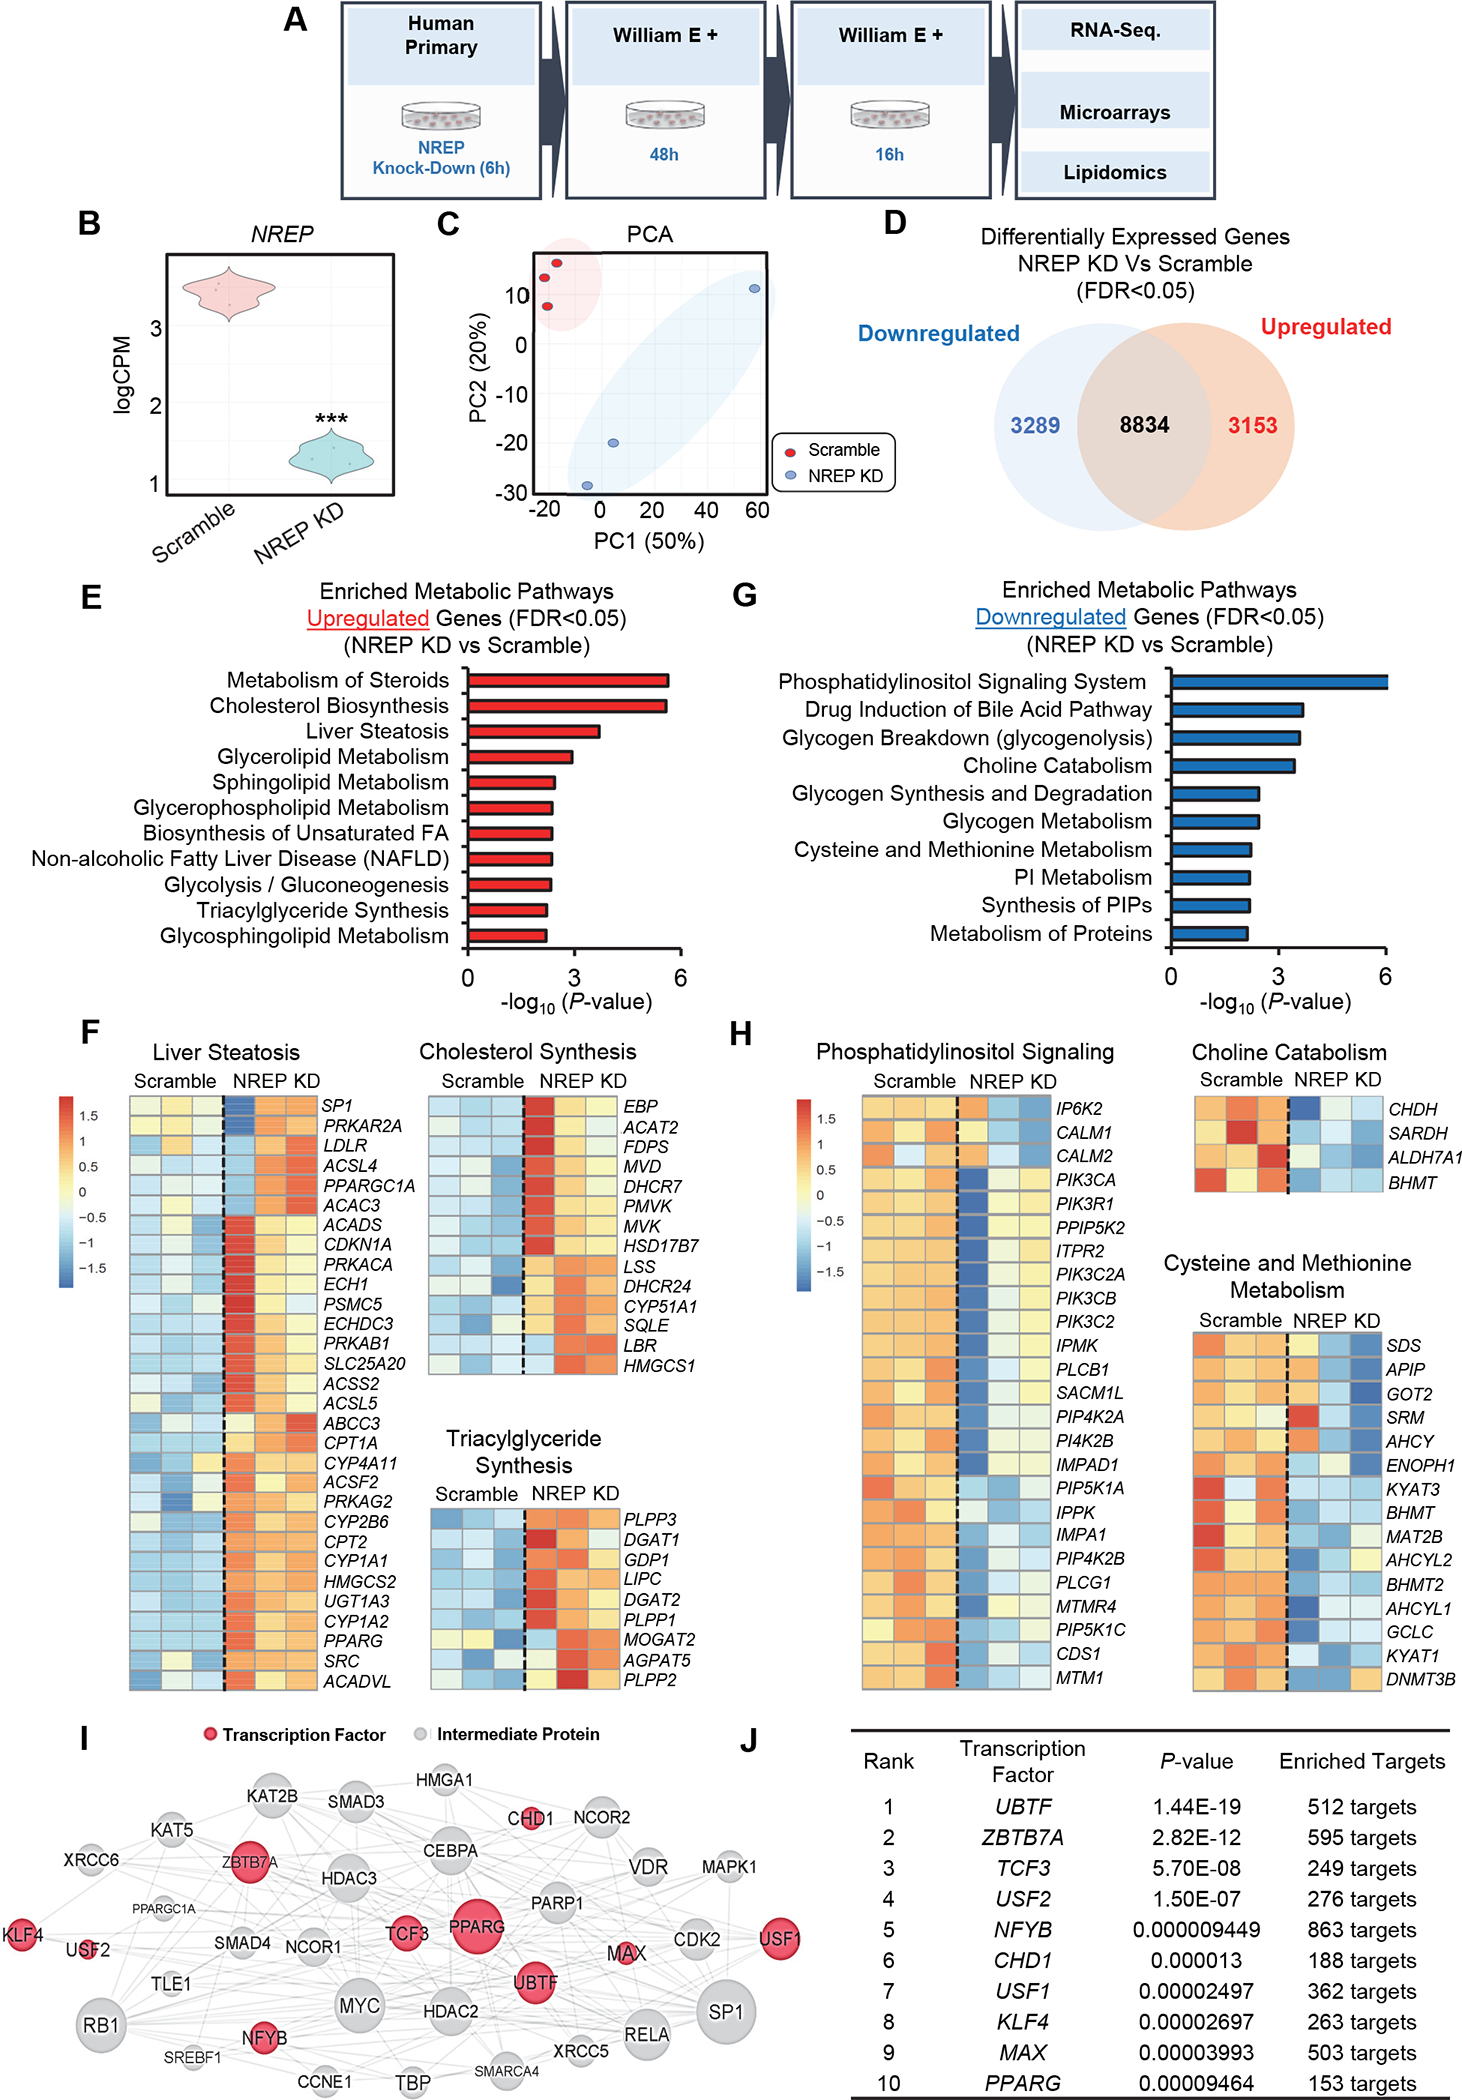
Figure 1: NREP silencing impacts hepatic cholesterol and one-carbon metabolism gene expression network in primary human hepatocytes.

(A) Study overview. (B) Violin-plot representation of NREP mRNA levels in Scramble (represented in red) and NREP knock-down (KD) cells (represented in blue) measured by RNA-seq. (C) Principal component analyses (PCA). (D) Venn diagram of downregulated versus upregulated genes. (E) Pathway enrichment analyses on metabolism-associated upregulated genes. (F) Heat map representation of downregulated pathways and genes. (G) Pathway enrichment analyses on metabolic-associated downregulated genes. (H) Heat map representation of downregulated pathways and genes. (I) Induced network analyses of enriched transcription factors in NREP KD compared to Scramble. (J) Enriched transcription factors in NREP KD compared to Scramble. All, n=3 biological replicates/group. Statistical analyses were performed by Benjamini-Hochberg method (see Methods). All represented genes with FDR<0.05 in NREP KD compared to Scramble. Transcription factor upstream analyses with genes FDR<0.01 in NREP KD compared to Scramble.
