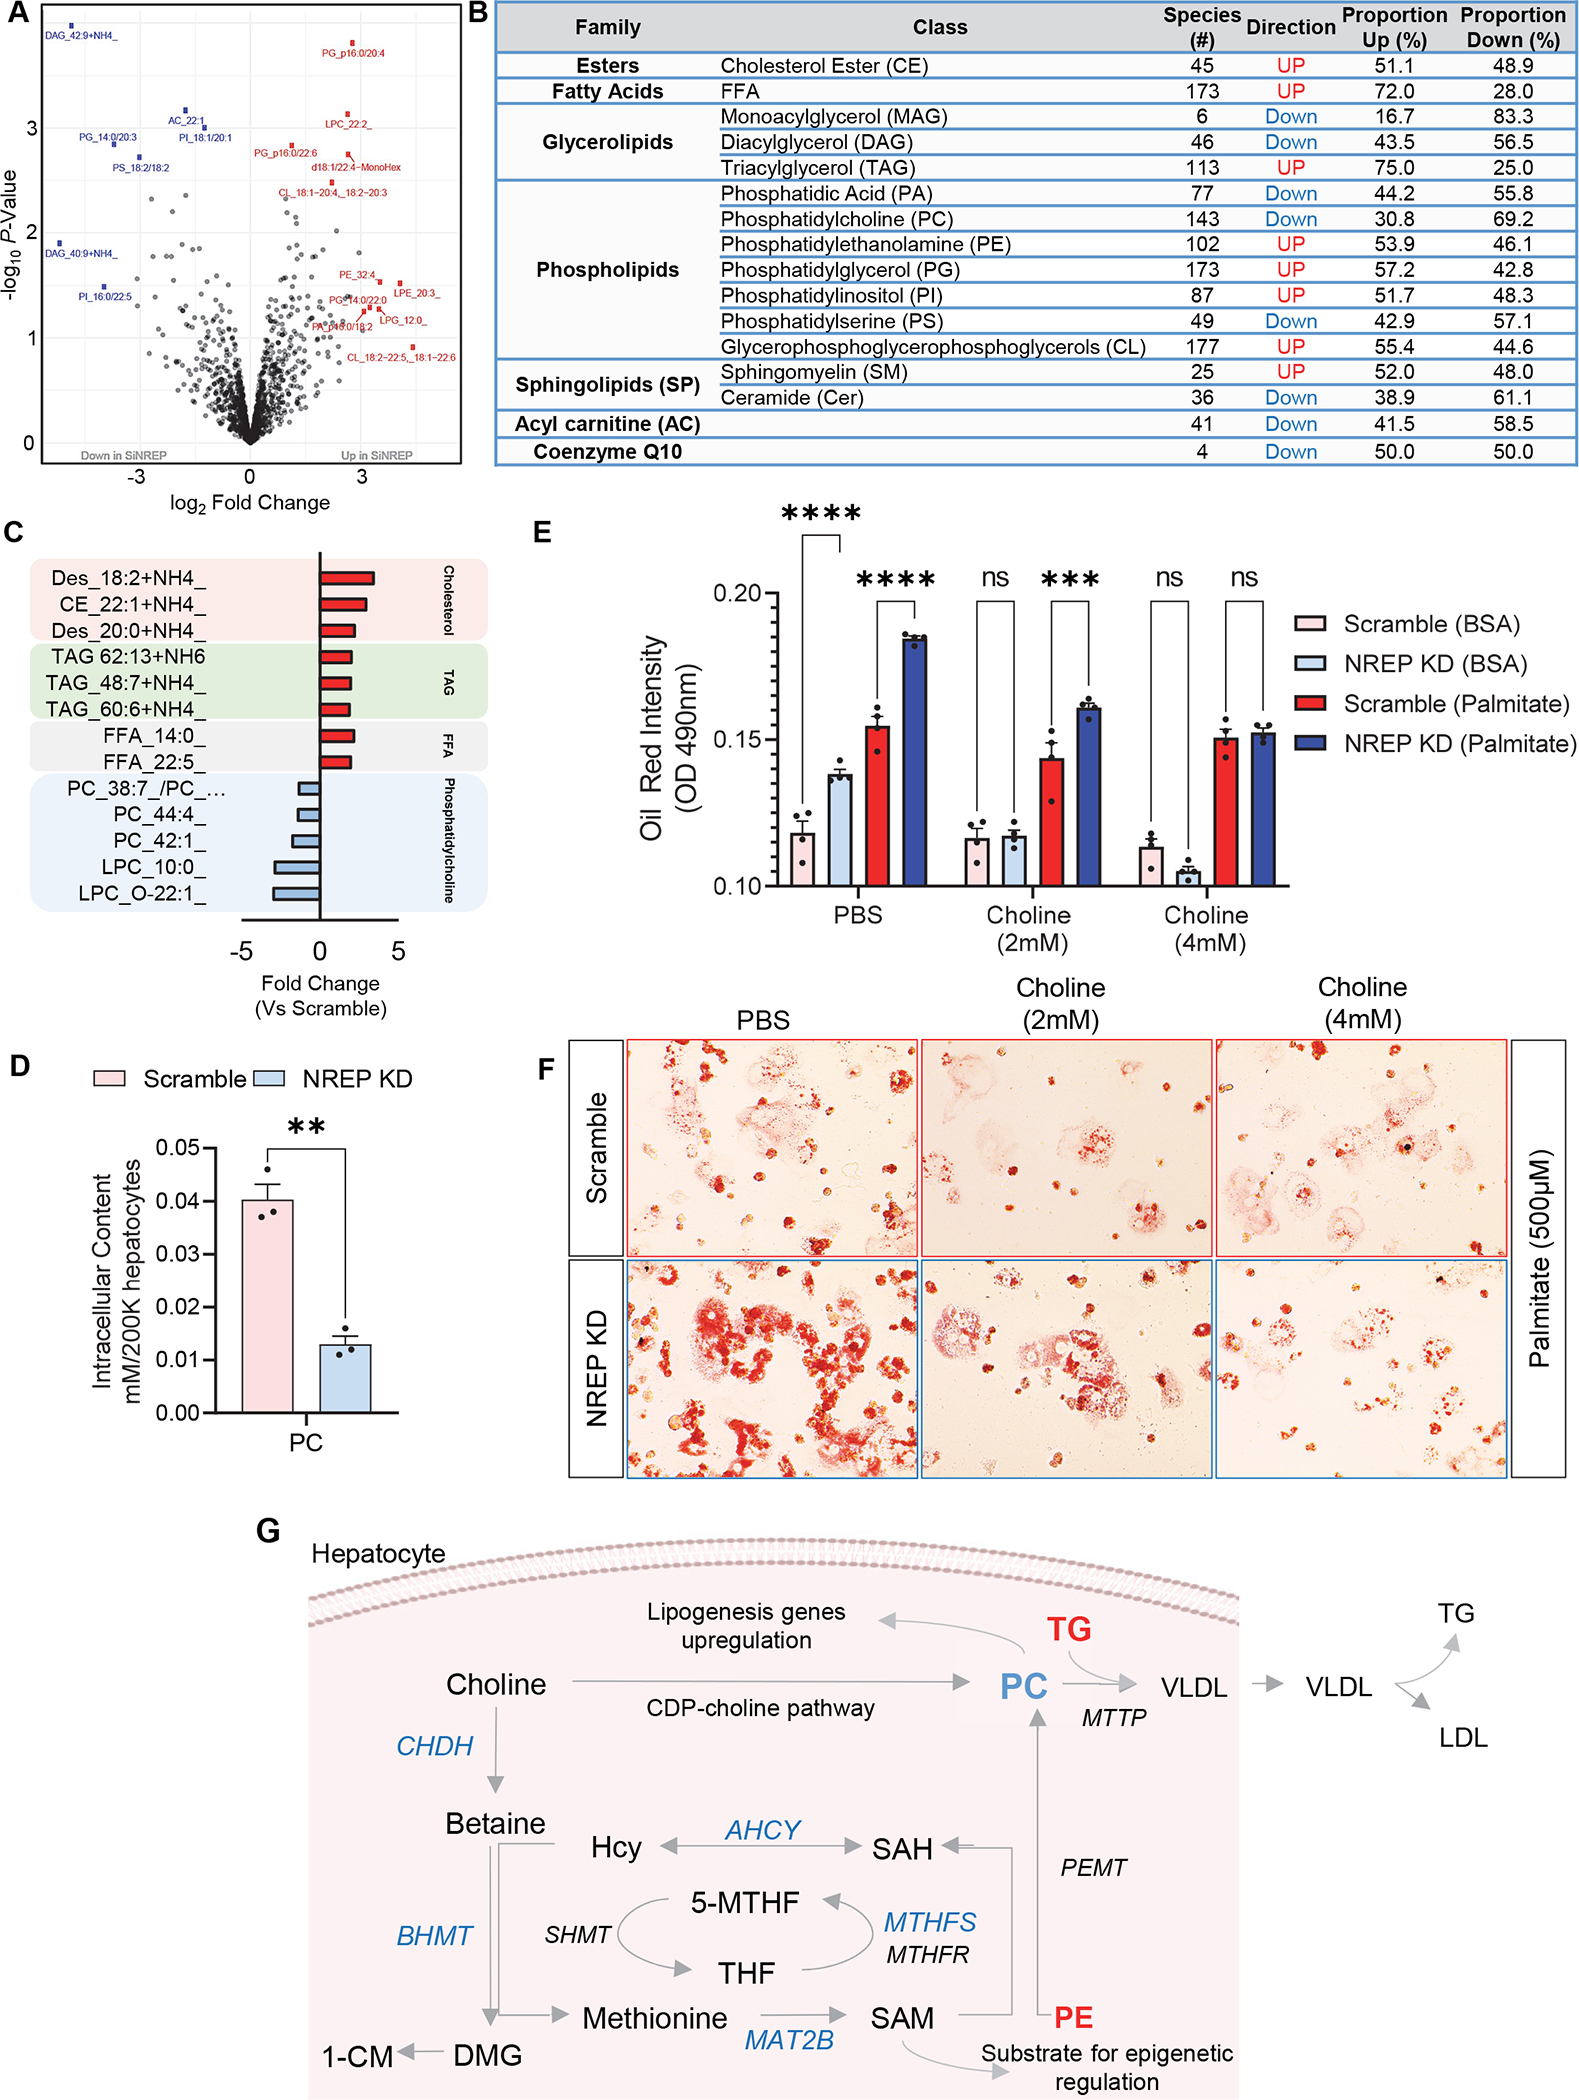
Figure 3: NREP downregulation bridges one-carbon metabolism and NAFLD development by decreasing phosphatidylcholine levels in primary human hepatocytes.

(A) Volcano-plot of lipidomics analysis in primary human hepatocytes harboring NREP KD compared to Scramble hepatocytes. (B) Effect of NREP KD on lipid class composition in primary human hepatocytes. (C) Cholesterol, free fatty acids, and PC lipid species most significantly impacted by NREP KD (P<0.05). (D) Phosphatidylcholine content levels in NREP KD and Scramble primary human hepatocytes (n=3). (E) Oil red intensity in Scramble or NREP KD primary human hepatocytes treated for 24h with PBS or choline chloride in the presence of BSA or 500 μM palmitate (n=4). (F) Representative oil red staining of Scramble or NREP KD cells challenged with 500 μM palmitate in the presence of PBS, 2mM choline chloride, or 4mM of choline chloride (n=4). (G) Scheme depicting one-carbon metabolism link with phosphatidylcholine synthesis and hepatic triglycerides export. PC, phosphatidylcholine; TG, triglycerides; Hcy, homocysteine; SAH, S-adenosylhomocysteine; SAM, S-adenosylmethionine; THF, tetrahydrofolate. Genes are depicted in italic. Downregulated genes in blue. Lipid classes in bold; Red represents upregulated and blue downregulated upon NREP KD compared to Scramble. All, n=3 (or otherwise stated) biological replicates/group. Statistical analyses by Benjamini-Hochberg method in A, B, and C. Unpaired Two-tailed t-test in D. Two-way ANOVA with Turkey’s multiple comparisons test in E.
