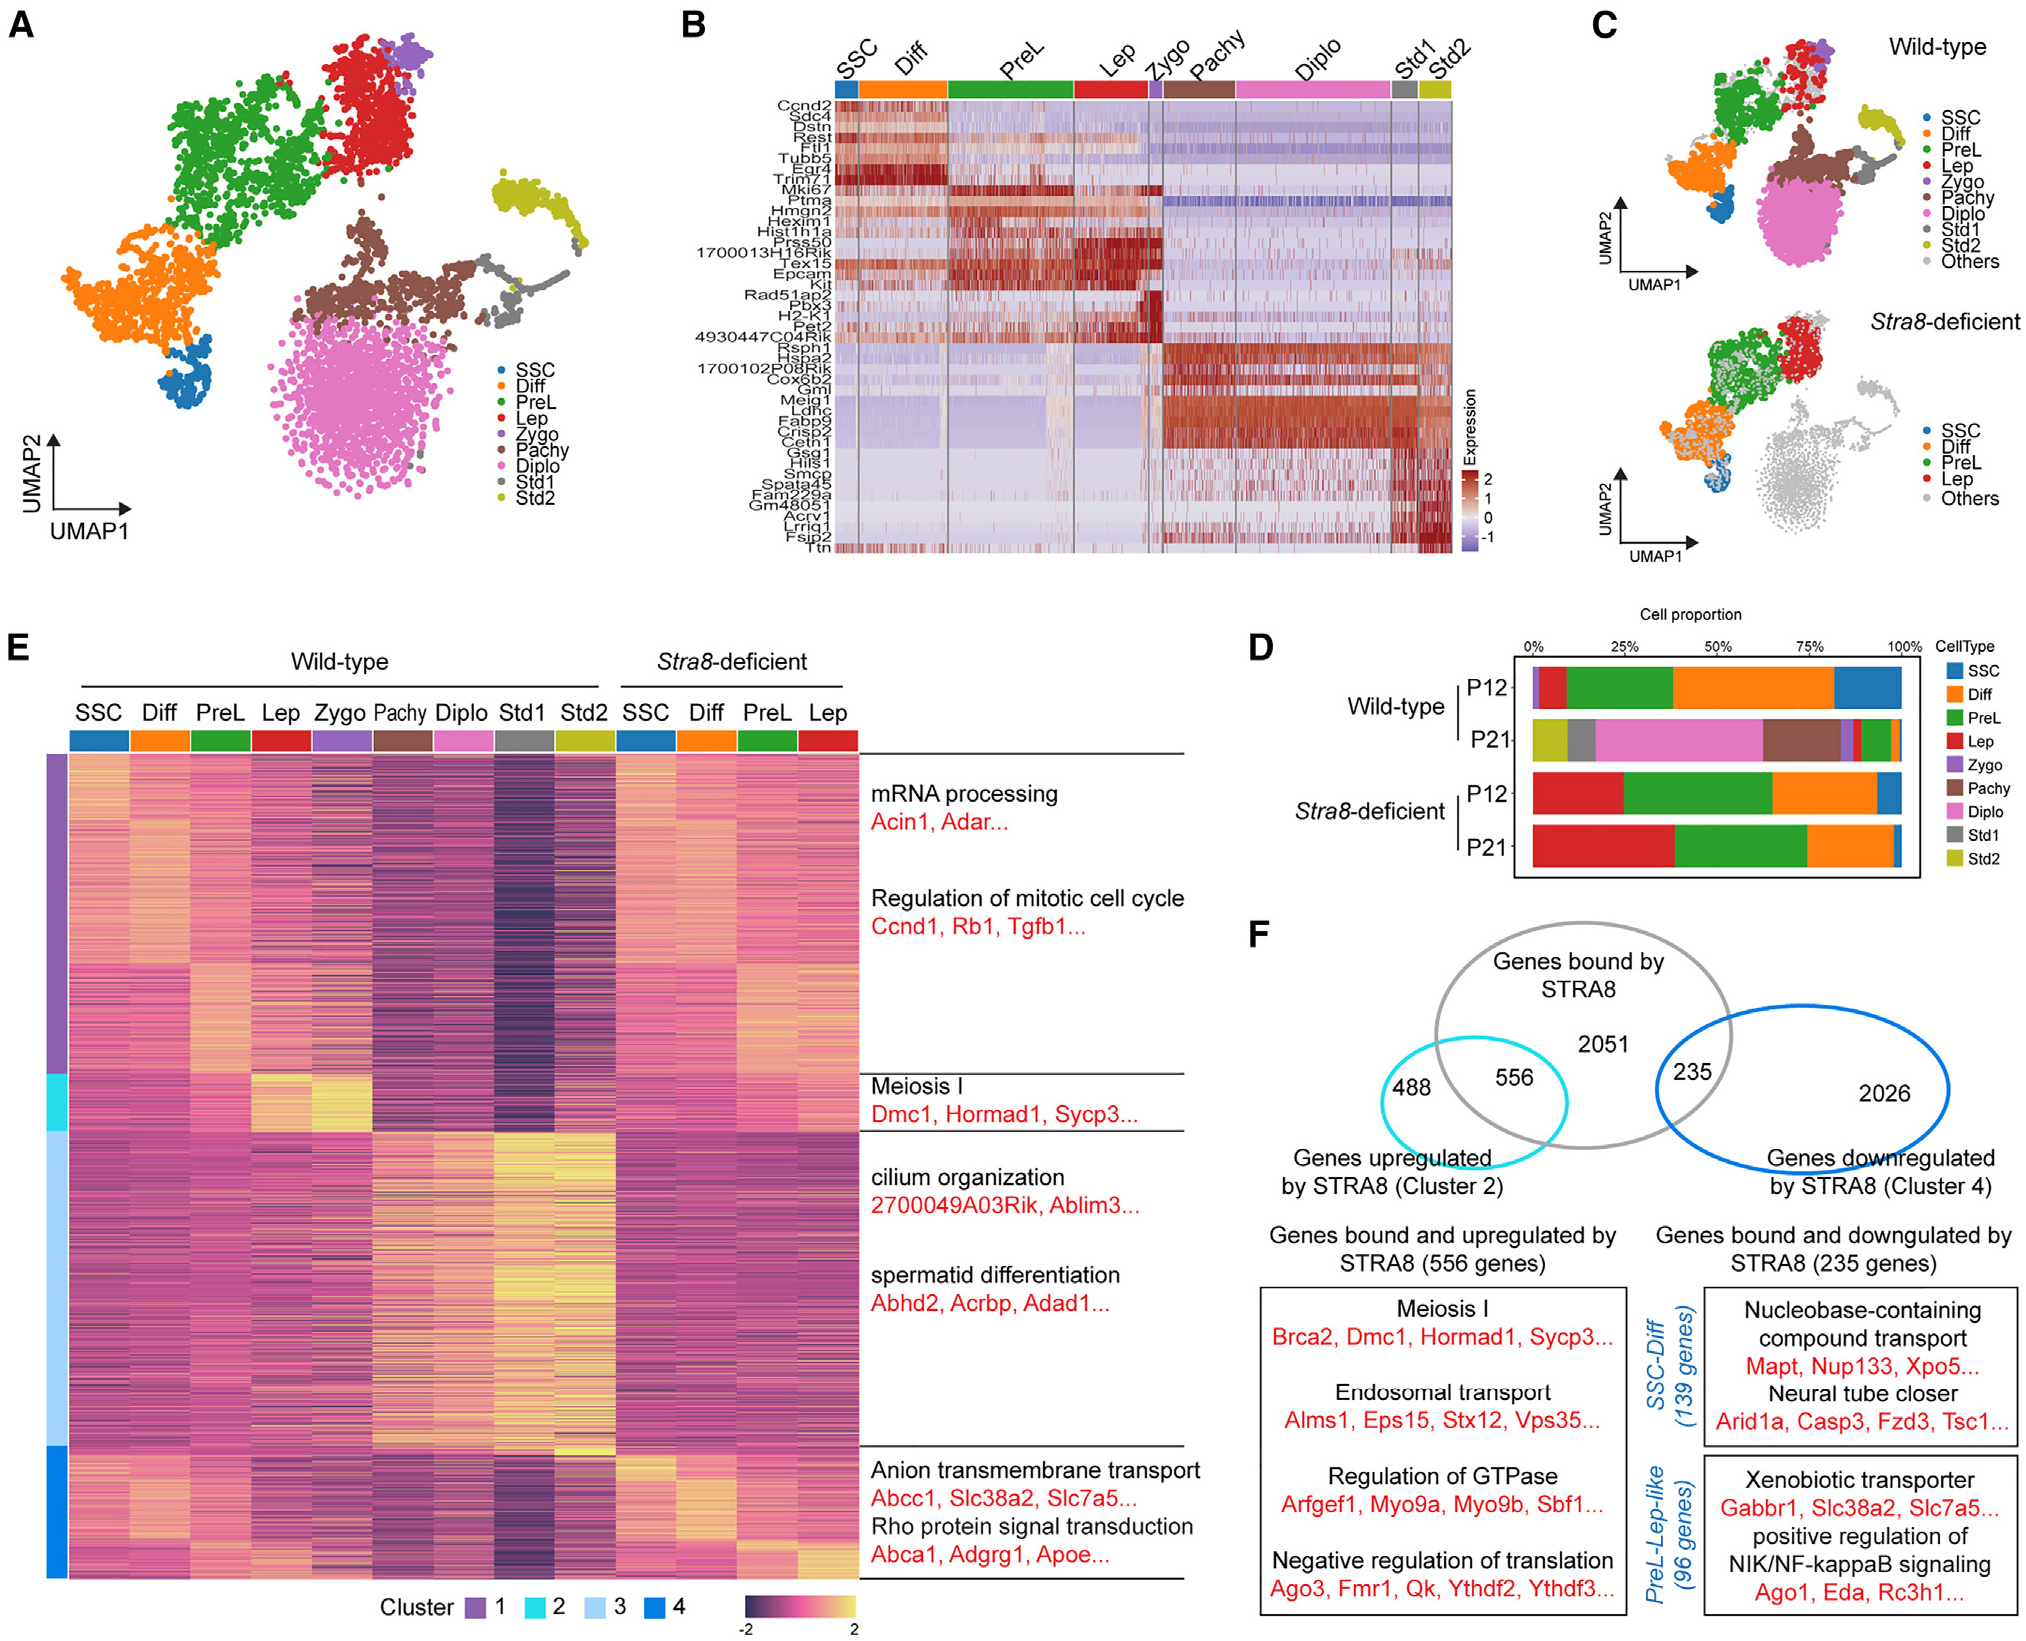
Figure 1. scRNA-seq of wild-type and Stra8-deficient germ cells at P12 and P21.

(A) Uniform manifold approximation and projection (UMAP) visualization of integrated projection from wild-type and Stra8-deficient germ cells at P12 and P21.
(B) Heatmap showing the expression of marker genes in each cluster.
(C) UMAP visualization of split projection by wild-type and Stra8-deficient germ cells.
(D) Bar plot showing the proportion of the different cell clusters at different time points.
(E) Clusters of genes across different cell types in wild-type and Stra8-deficient germ cells. Genes are grouped by activity cluster. Shown on the right are representative enrichments of biological processes.
(F) Venn diagrams with genes bound by Stra8 and representative genes that are upregulated and downregulated in wild-type and Stra8-deficient germ cells at the indicated stages.
See also Figures S1 and S2.
