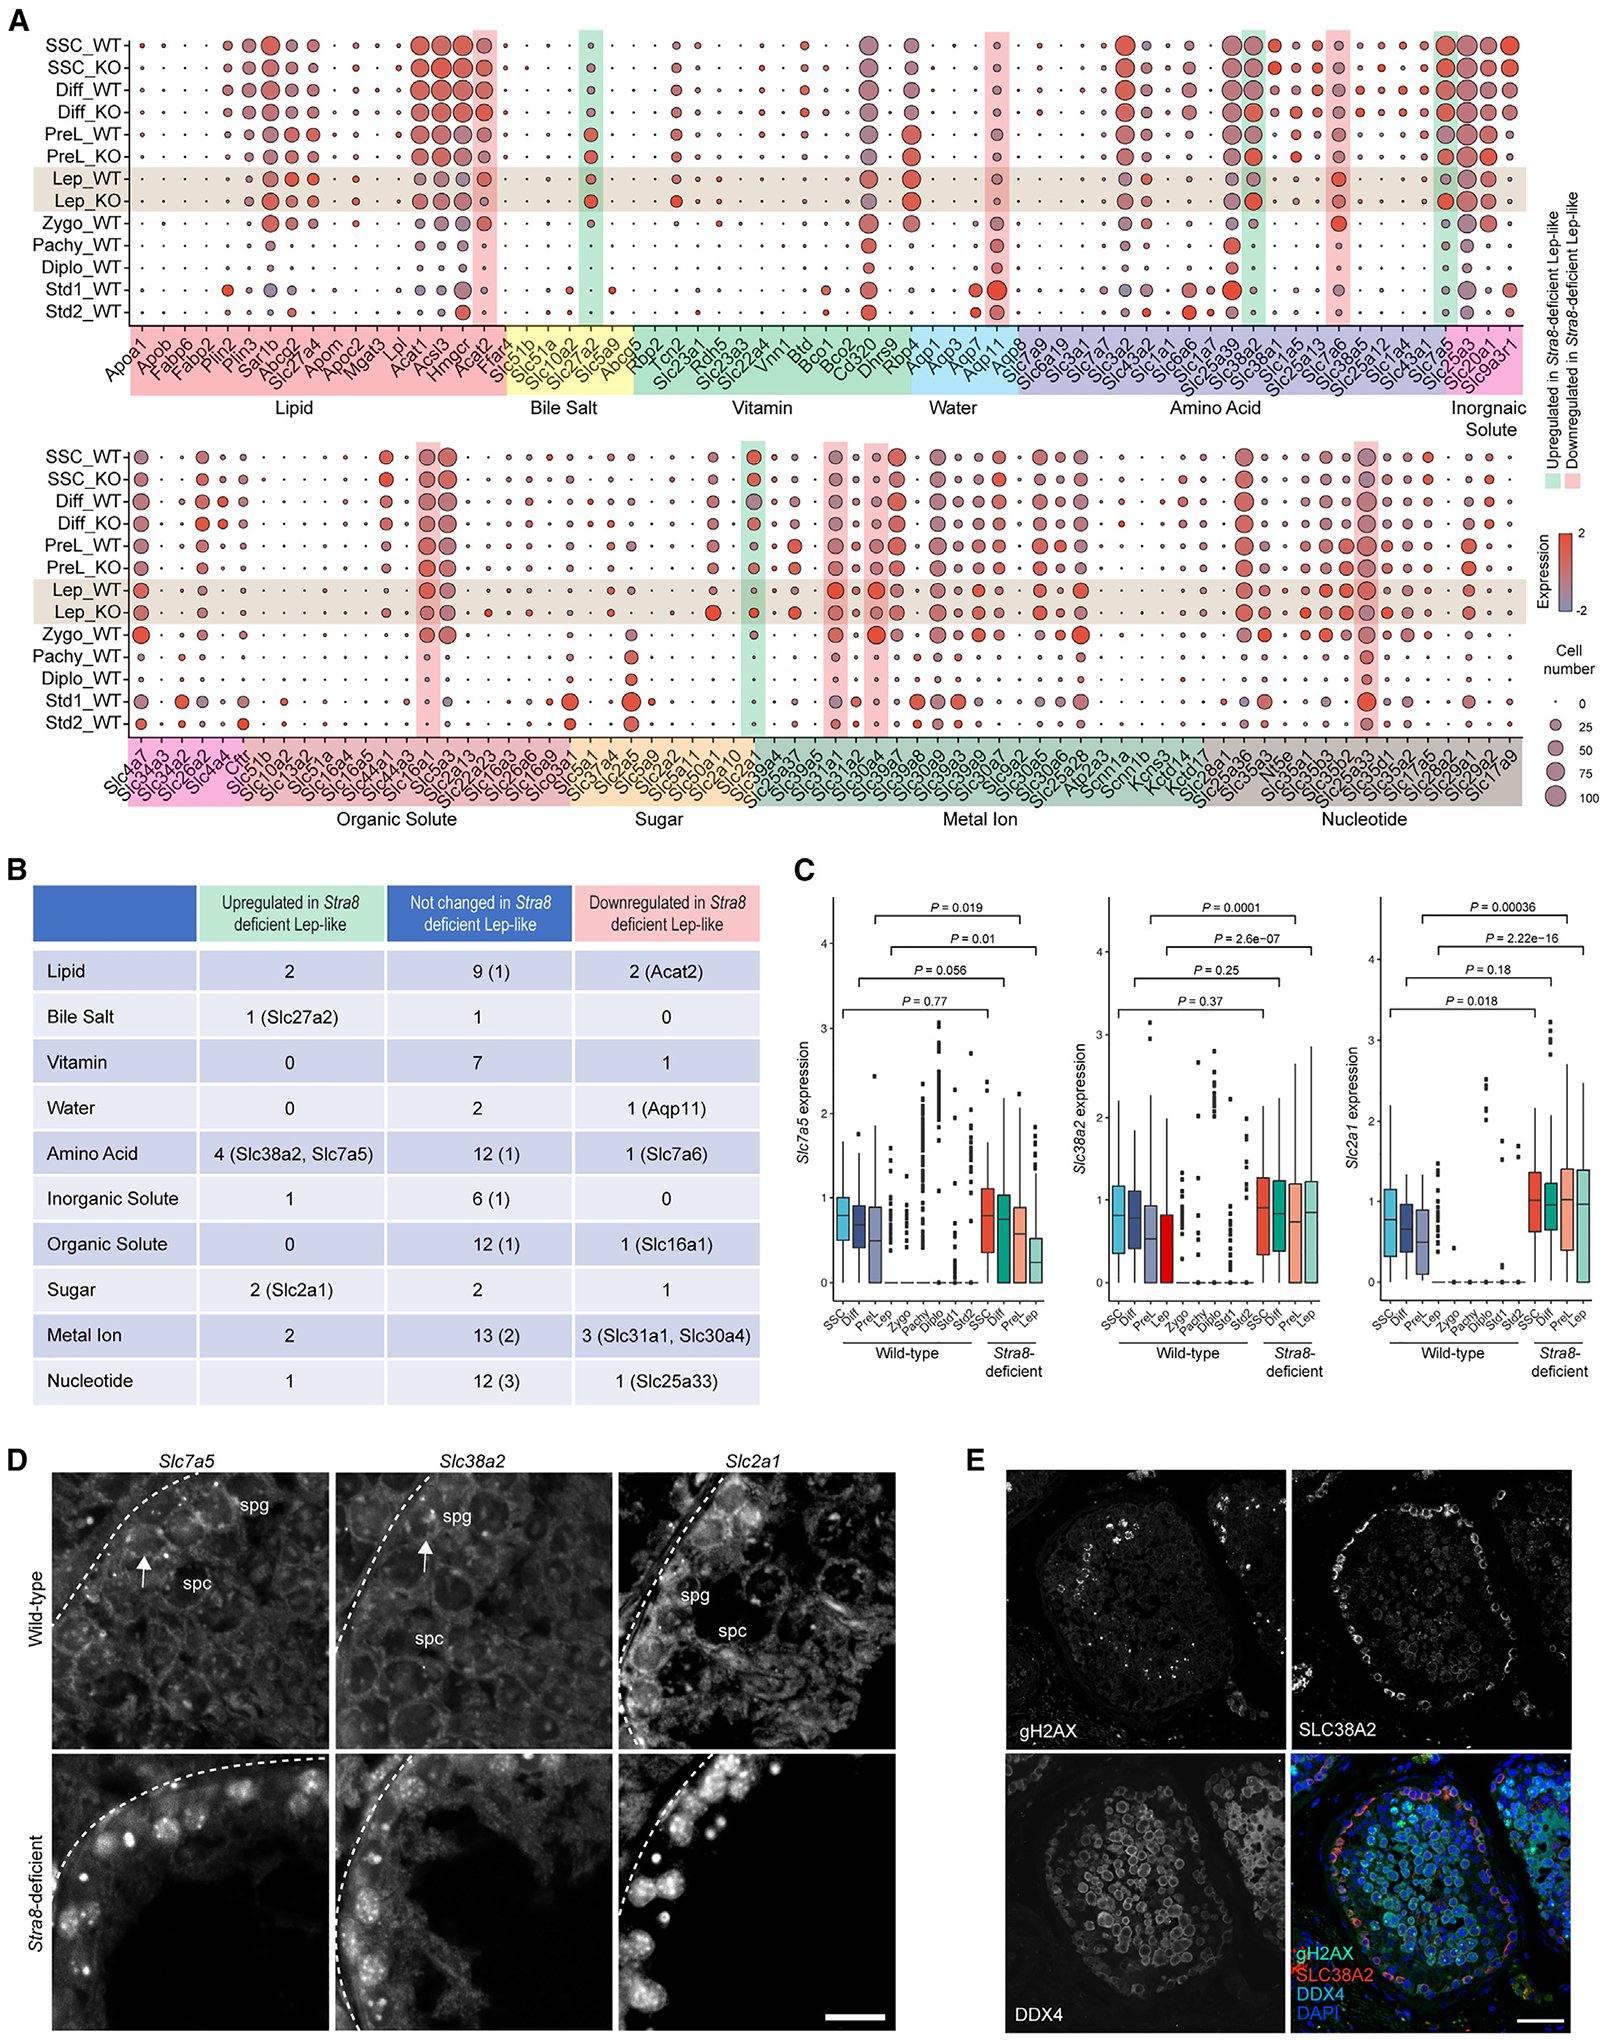
Figure 2. Nutrient transporter gene expression in wild-type and Stra8-deficient germ cells.

(A) Expression patterns of specific genes involved in nutrient absorption and transport in each cell type in wild-type and Stra8-deficient germ cells. Each dot represents a gene, of which the color saturation indicates the average gene-expression level and the size indicates the percentage of cells expressing the gene.
(B) Table summarizing nutrient transporter genes that are upregulated and downregulated genes in wild-type and Stra8-deficient germ cells at the leptotene stage. Genes bound by Stra8 are indicated in parentheses.
(C) Box plot showing the expression levels of Slc7a5, Slc38a2, and Slc2a1 at different stages of spermatogenesis in wild-type and Stra8-deficient germ cells (median ± SE). Statistical analyses between wild-type and Stra8-deficient samples in each cell type were performed using Student’s t test, with p values shown.
(D) ISH of Slc7a5, Slc38a2, and Slc2a1 mRNA in wild-type and Stra8-deficient testes. Scale bar, 20 μm.
(E) Staining of human testicular cross-sections using SLC38A2, γH2AX, VASA, and DAPI. VASA indicates germ cells. γH2AX indicates meiotic germ cells. Scale bar, 50 μm.
See also Figures S3 and S4.
