
Figure 3. Regulation of nutrient transporter gene expression by Stra8.
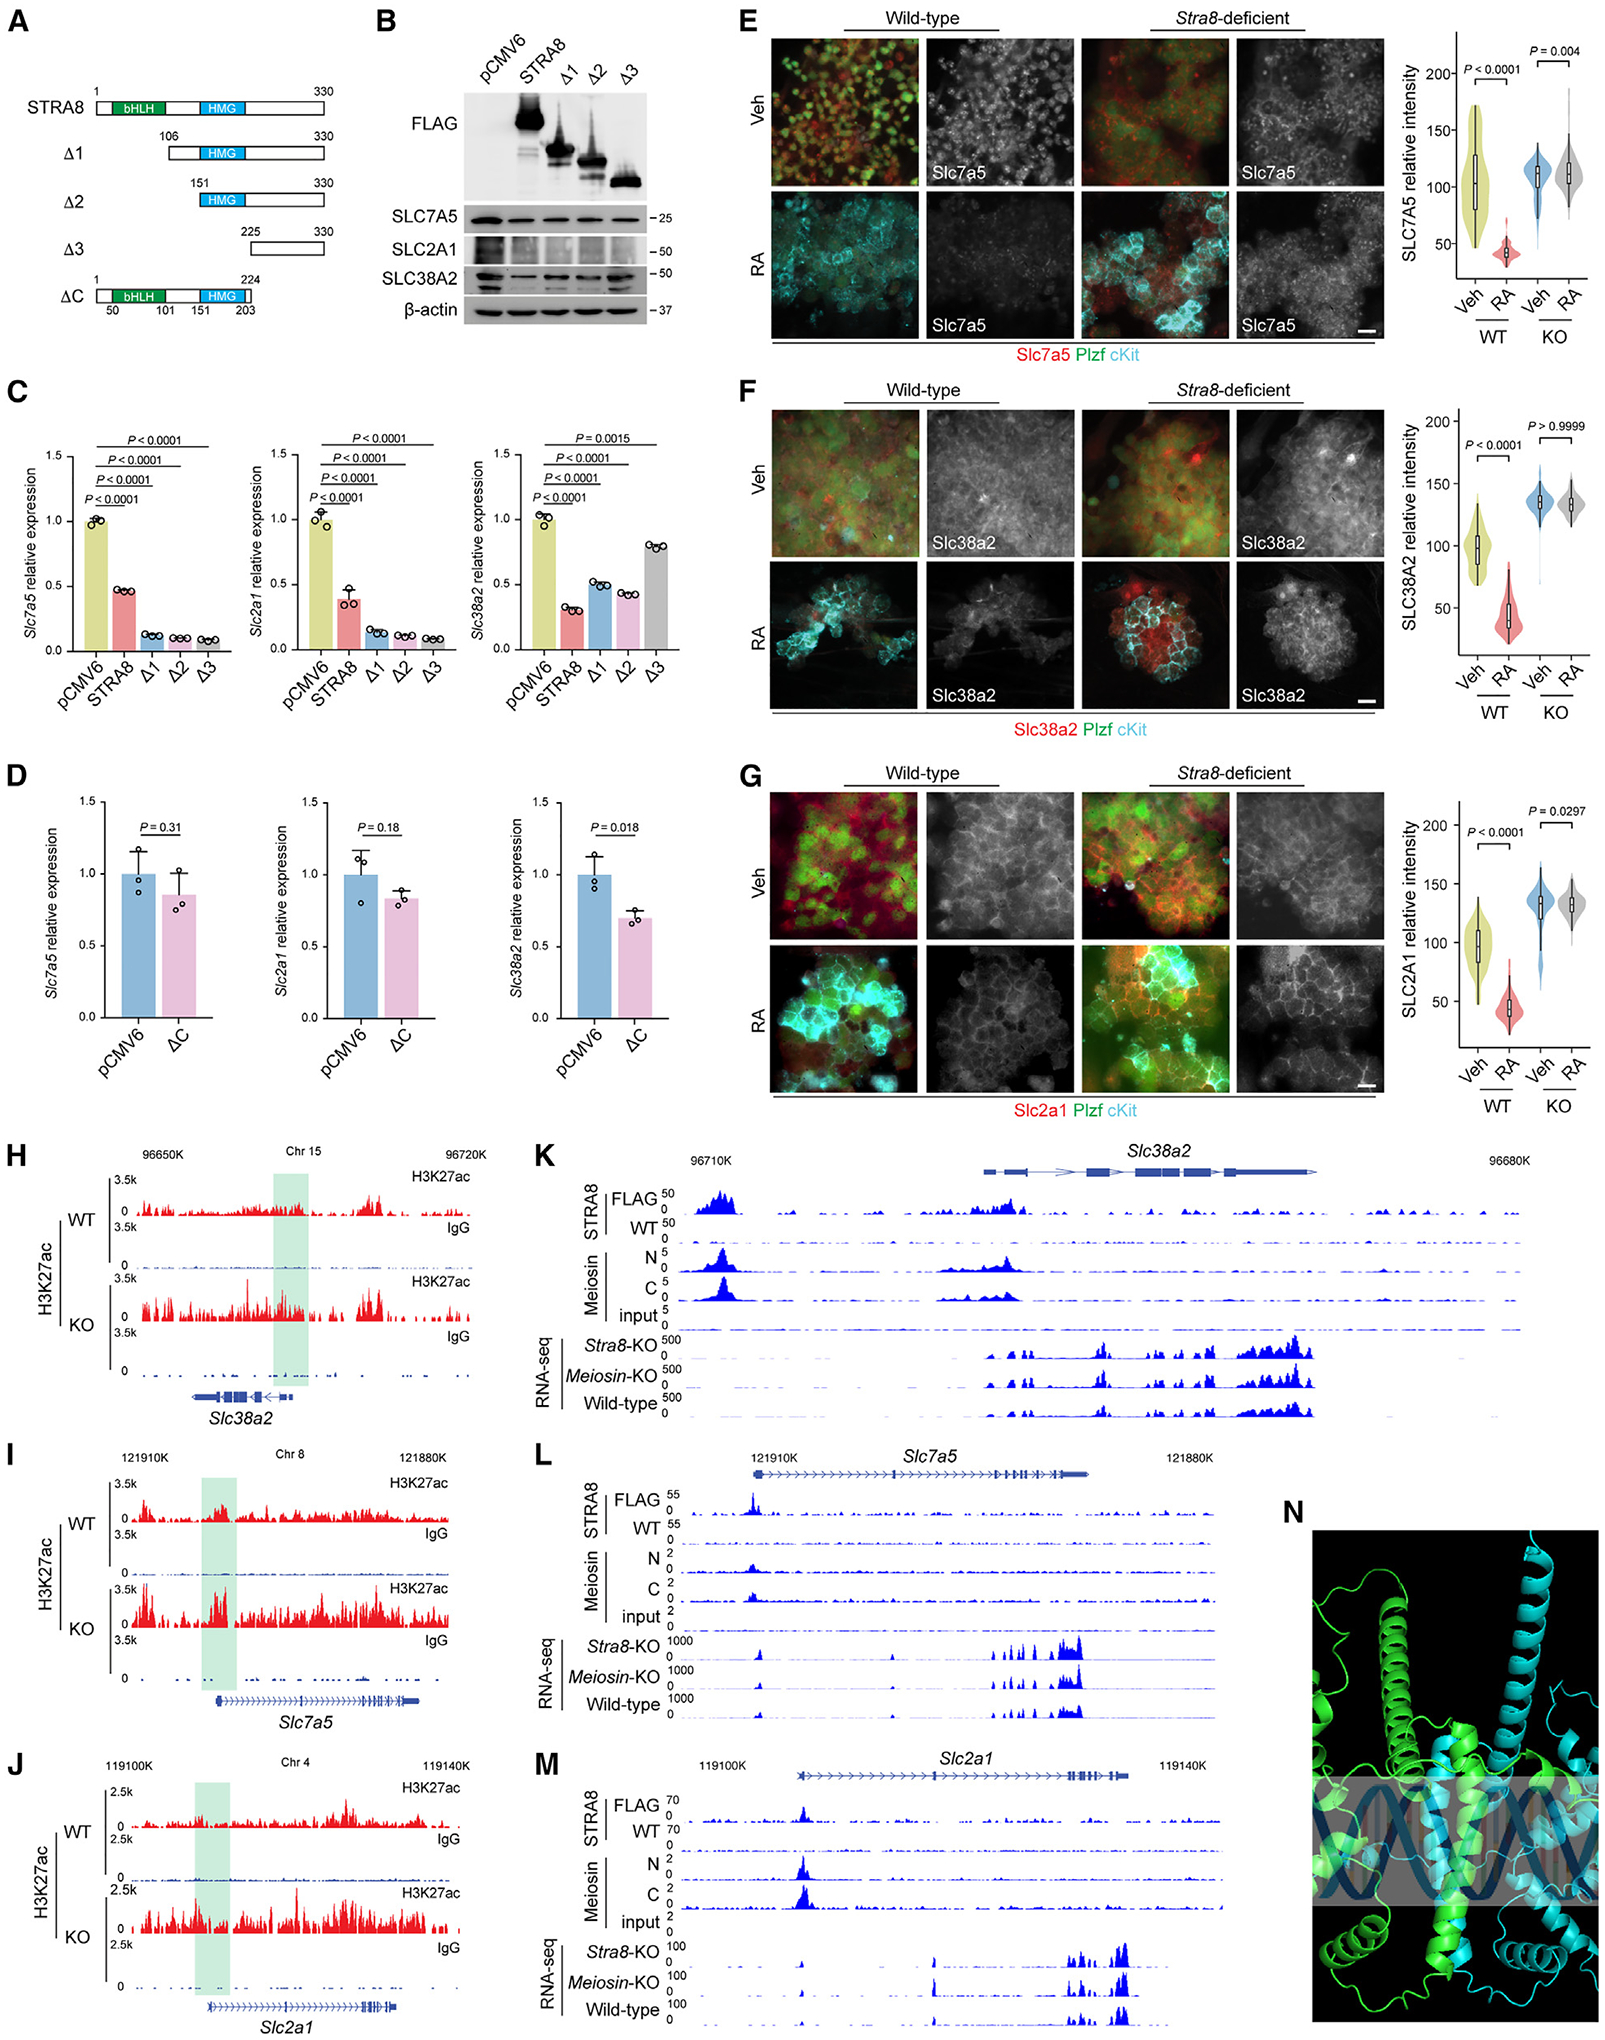
(A) Schematic representation of full-length Stra8 and its deletion constructs.
(B) The levels of Stra8 and its deletion constructs were detected by immunoblotting with an antibody against FLAG. Immunoblotting with antibodies against transporter proteins are shown.
(C and D) qPCR analysis of Slc7a5, Slc38a2, and Slc2a1 expression following transient transfection of STRA8 and its N terminus deletion mutants (C) and C terminus deletion mutant (D) into F9 cells for 48 h. Data represent mean ± SE. n = 3 independent transfections. Statistical analyses between full-length STRA8 and its N terminus deletion mutants (C) or its C terminus deletion mutant (D) were performed using Student’s t test, with p values shown.
(E–G) Representative immunofluorescence images of nutrient transporter protein Slc7a5 (E), Slc38a2 (F), and Slc2a1 (G) expression are shown in cultured wild-type (WT) and Stra8-deficient (KO) spermatogonial stem cells (SSCs) with or without RA treatment (100 nM) for 24 h. Scale bars, 10 μm. Violin plots of quantification results are shown on the right. p values were calculated by one-way ANOVA with Bonferroni’s multiple comparison test.
(H–J) Genome tracks of the Slc38a2 (H), Slc7a5 (I), and Slc2a1 (J) genes for CUT&RUN of H3K27ac using wild-type and Stra8-deficient testes at P12. In CUT&RUN of H3K27ac, samples incubated with preimmune immunoglobulin G were used as the negative controls.
(K–M) Genome tracks of the Slc38a2 (K), Slc7a5 (L), and Slc2a1 (M) genes for Stra8 ChIP-seq, Meiosin ChIP-seq, and RNA-seq with indicated genotypes. In Stra8-ChIP-seq, FLAG antibody was used to pull down Stra8 in FLAG-tagged Stra8 knockin mouse. Wild-type cells, in which Stra8 is not tagged, were used as the negative control.
(N) AlphaFold2 to predict the structure of the human STRA8 and MEIOSIN complex.
See also Figures S3–S5.