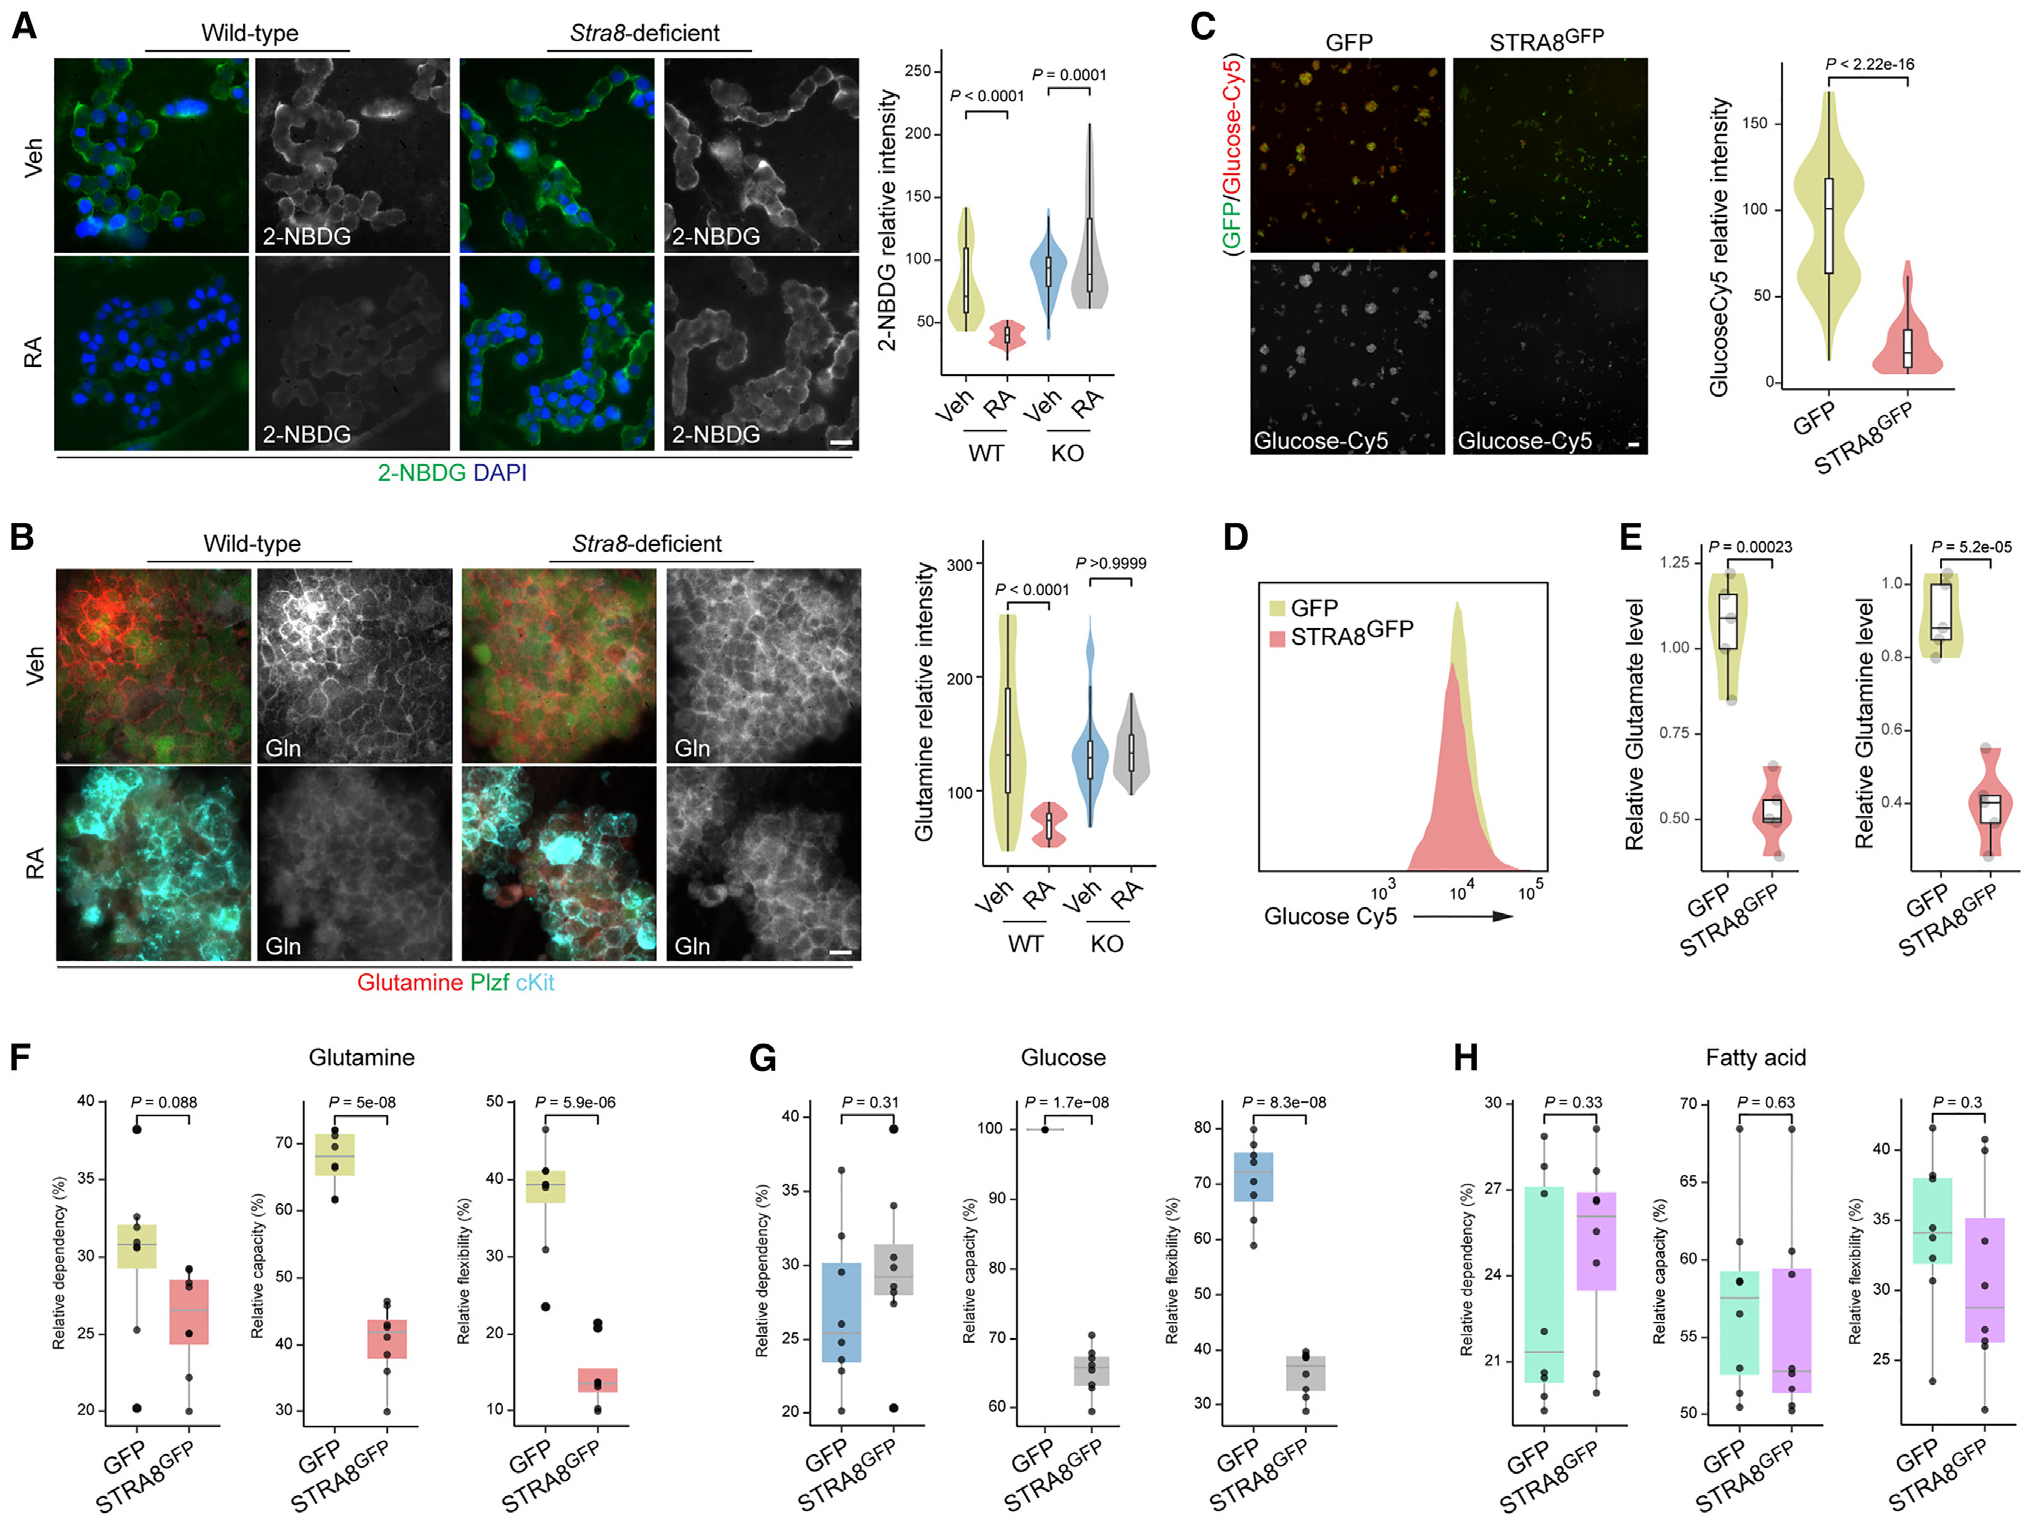
Figure 4. Stra8 regulates glutamine and glucose uptake.

(A) The fluorescence of 2-(N-(7-nitrobenz-2-oxa-1,3-diazol-4-yl)amino)-2-deoxyglucose (2-NBDG) was measured, with representative statistical plot profiles of cultured wild-type (WT) and Stra8-deficient SSCs with or without RA treatment (100 nM) for 24 h. Representative images from three independent experiments. Scale bar, 10 μm. Violin plots of quantification results are shown on the right. p values were calculated by one-way ANOVA with Bonferroni’s multiple comparisons test.
(B) Representative immunofluorescence of glutamine staining detected, with representative statistical plot profiles of cultured wild-type and Stra8-deficient SSCs with or without RA treatment (100 nM in DMSO) for 24 h. Representative images from three independent experiments. Gln, glutamine. Scale bar, 10 μm. Violin plots of quantification results are shown on the right. p values were calculated by one-way ANOVA with Bonferroni’s multiple comparison test.
(C) Fluorescence of glucose-Cy5 staining detected and representative violin plot profiles of F9 cells transfected with GFP (control) and Stra8GFP expression plasmids. Representative images from three independent experiments. Scale bar, 10 μm. Violin plots of quantification results are shown on the right. p value was calculated by Student’s t test.
(D) FACS plot for detection of glucose-Cy5 and representative plot profiles of F9 cells transfected with expression plasmids for GFP (control) and Stra8GFP.
(E) Glutamate and glutamine levels were measured in cultured F9 cells transfected with GFP (control) and Stra8GFP expression plasmids. Violin plots of quantification results are shown on the right. p values were calculated by Student’s t test.
(F–H) Box plots of Mito Fuel Flex test profile for substrate fuel dependency, and the three major fuel pathways of glutamine (F), glucose (G), and fatty acid (H). p values were calculated by Student’s t test.
See also Figure S5.
