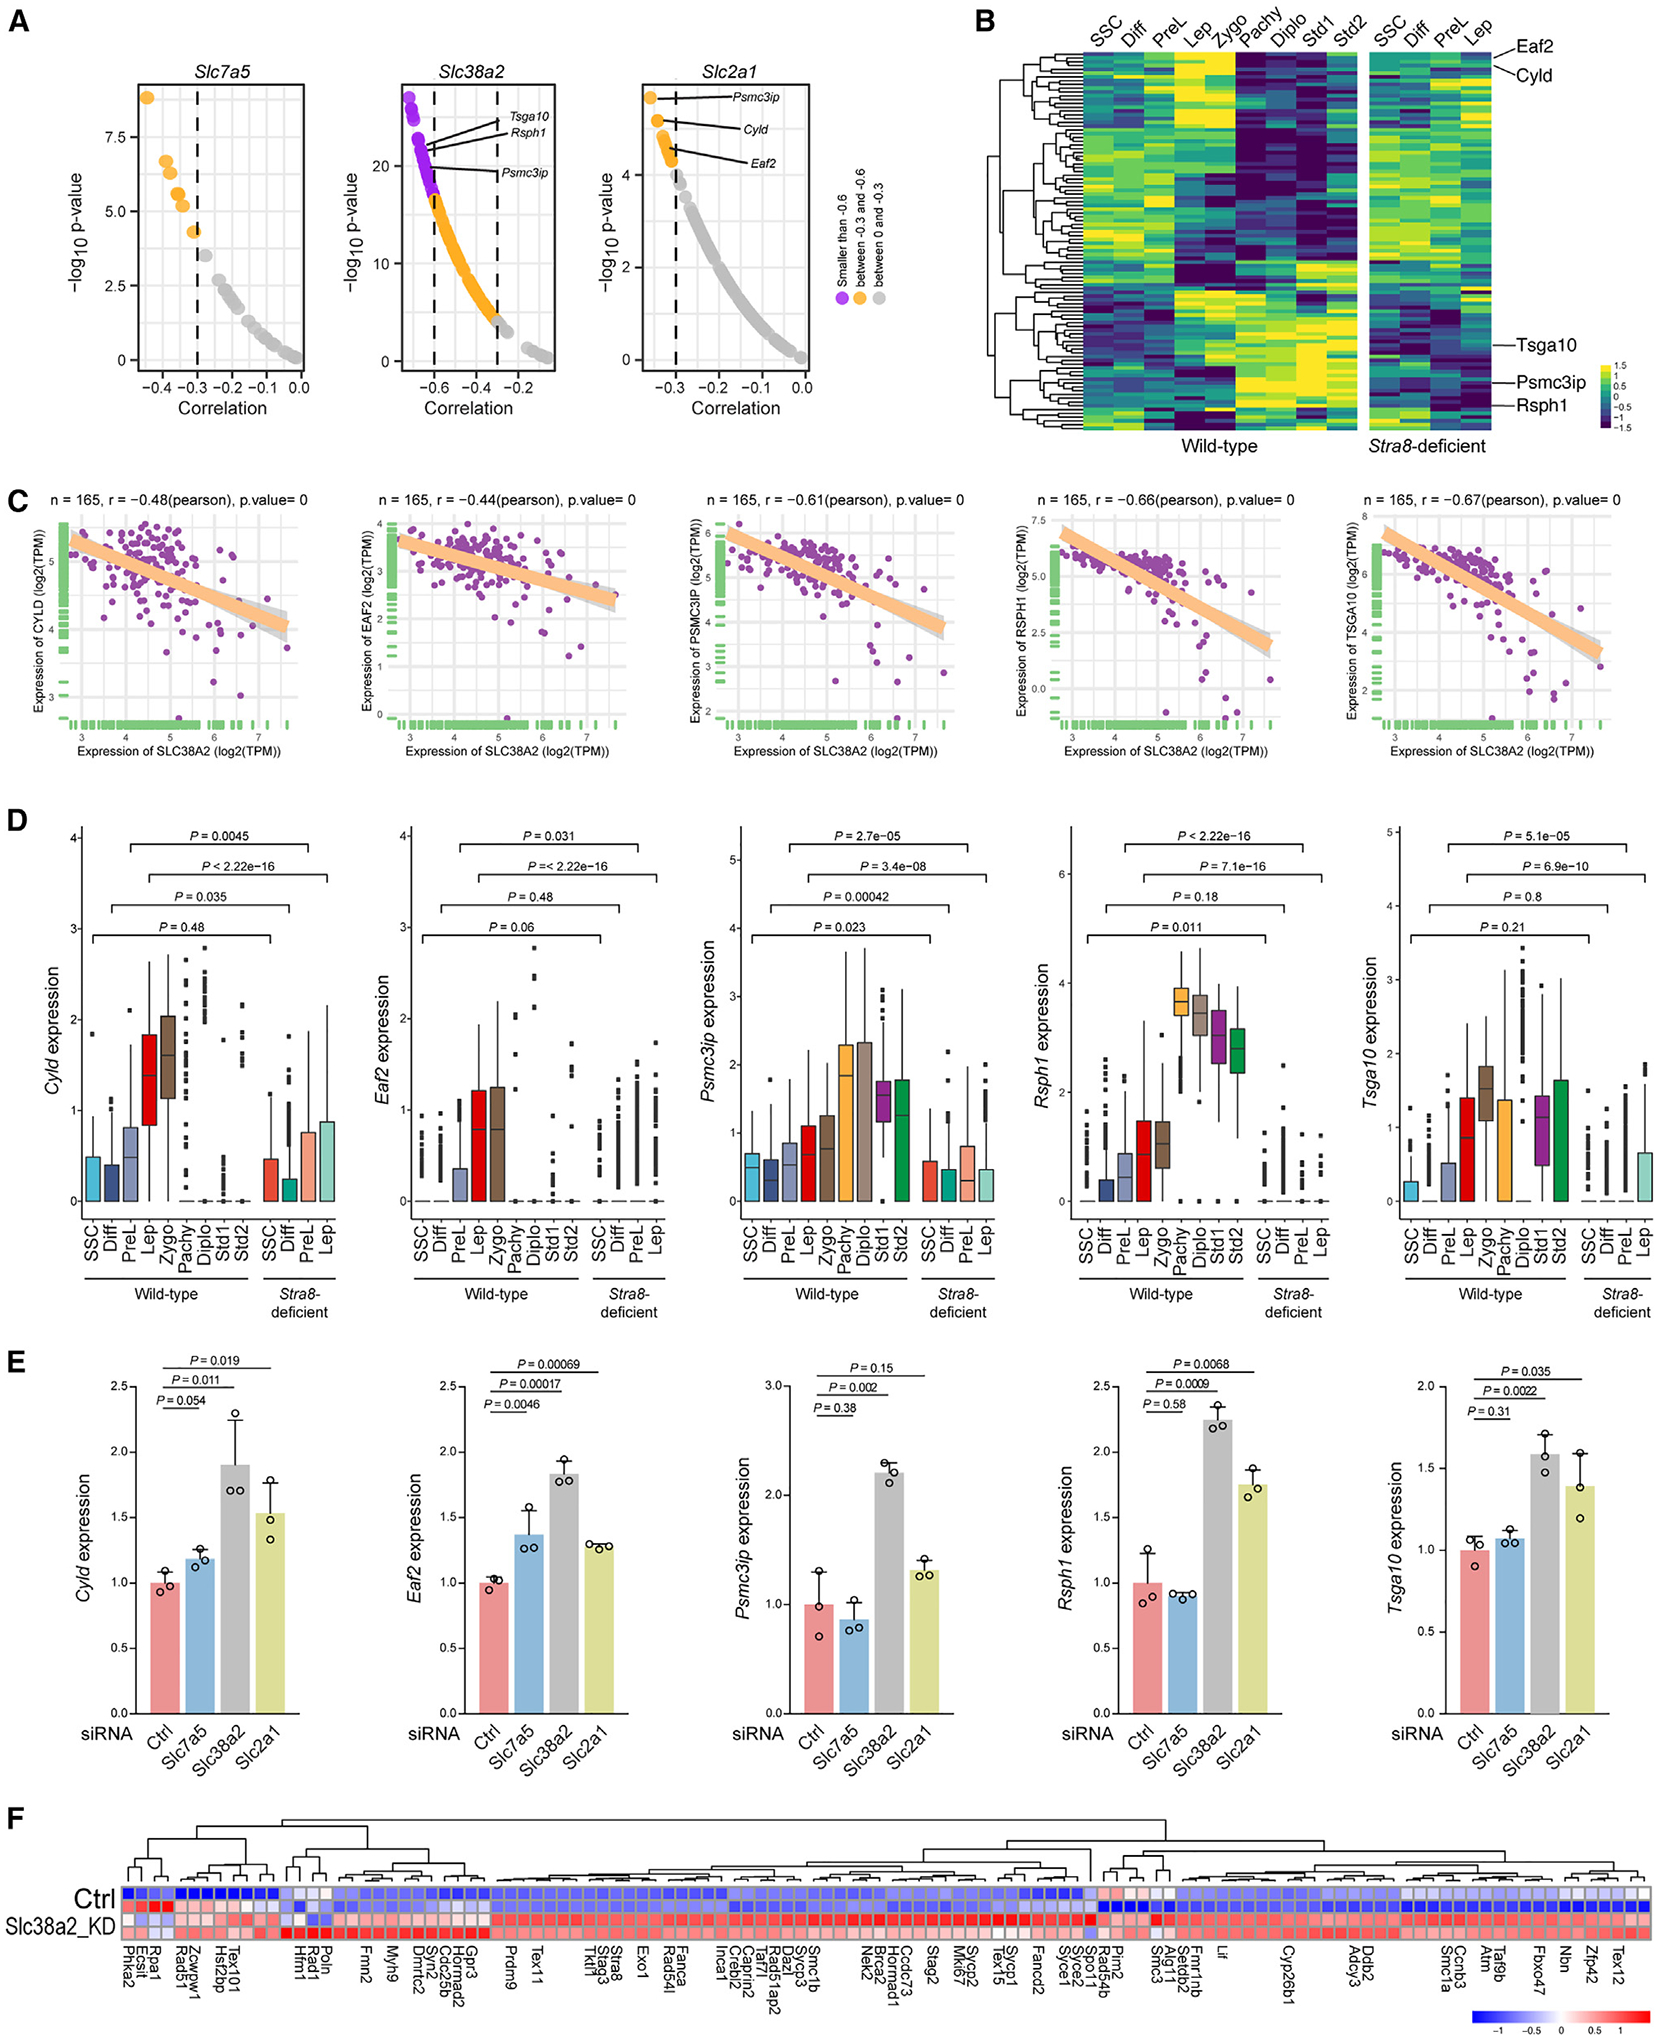
Figure 5. Nutrient transporters regulate meiotic gene expression.

(A) Top correlation of representative transporter genes (Slc7a5, Slc38a2, and Slc2a1) with selected meiotic genes in 165 testis samples in the GTEx datasets.
(B) Heatmap of the expression of meiotic genes that show strong or moderate correlation with nutrient transporter genes from the GTEx datasets in wild-type and Stra8-deficient germ cells. The top five meiotic genes that are negatively correlated with Slc38a2 and Slc2a1 and are decreased in Stra8-deficient germ cells are shown on the right.
(C) GTEx datasets showing the correlation of Slc38a2 with selected meiotic genes in 165 testis samples. The linear regression curve is demonstrated. The 95% confidence interval (shaded area) is shown in each panel. The range of confidence intervals is provided in the source data. Two-tailed t-statistic p value and coefficient (R) of Pearson’s correlation are shown at the top.
(D) Box plots showing the expression level of representative meiotic genes in each cluster from wild-type and Stra8-deficent germ cells. Statistical analyses between wild-type and Stra8-deficient samples in each cell type were performed using Student’s t test, with p values shown.
(E) qPCR showing the expression level of representative meiosis genes after Slc7a5, Slc38a2, and Slc2a1 knockdown in mouse SSC cultures. Data are median ± SE. Statistical analyses between samples with control siRNA and siRNA against Slc7a5, Slc38a2, and Slc2a1 were performed using Student’s t test, with p values shown.
(F) Heatmap of meiosis-related gene expression from control or Slc38a2 knockdown (Slc38a2 KD). Genes shown were selected from those that exhibited both a negative correlation with Slc38a2 in the GTEx dataset (A) and upregulation in Slc38a2 KD samples detected by RNA-seq.
See also Figure S6.
