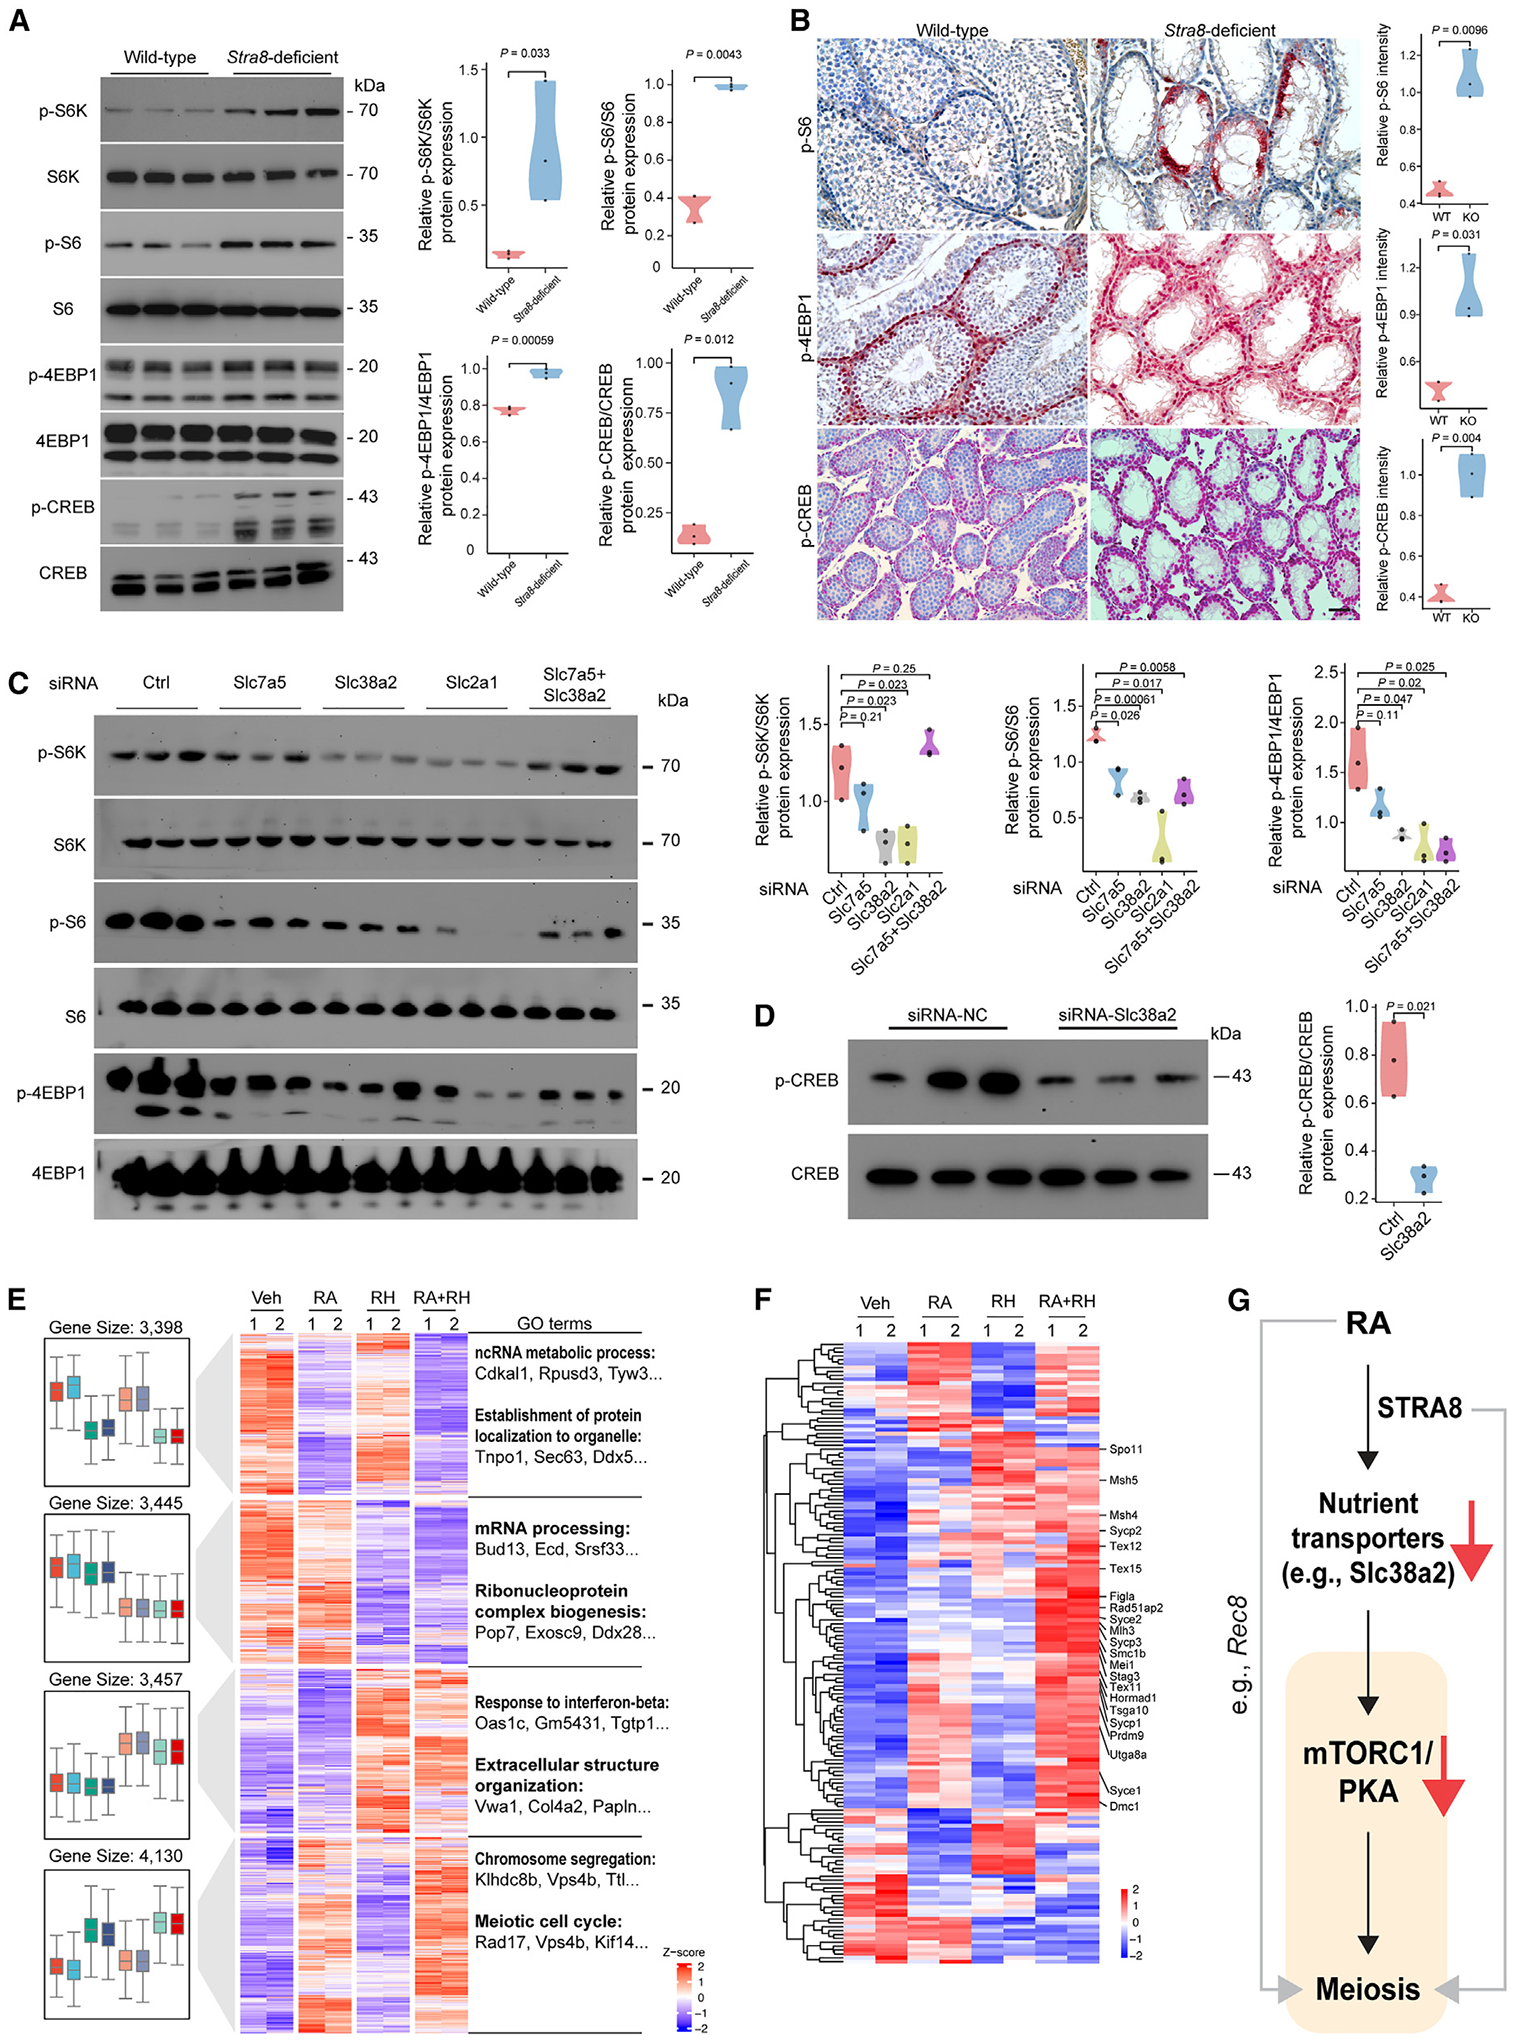
Figure 6. Nutrient transporters regulate mTORC1 and PKA activities.

(A) Representative immunoblotting analysis using total testicular lysates from wild-type and Stra8-deficient mice at P21. Right: violin plots of indicated phosphorylated proteins normalized to total proteins (n = 3). p values were calculated by Student’s t test.
(B) Representative images of p-S6, p-4EBP1, and p-CREB immunohistochemistry staining. Scale bars, 100 μm. Right: violin plots showing staining intensity of indicated proteins (n = 3). p values were calculated by Student’s t test.
(C) Representative immunoblotting analysis using total lysates from Slc7a5, Slc38a2, Slc2a1, and Slc7a5+Slc38a2 knockdown cells. Right: violin plots of indicated phosphorylated proteins normalized to total proteins (n = 3). Statistical analyses between samples with control siRNA and siRNA against Slc7a5, Slc38a2, Slc2a1, and Slc7a5+Slc38a2 were performed using Student’s t test, with p values shown.
(D) Representative immunoblotting analysis using total lysates from Slc38a2 knockdown cells. Right: violin plots of indicated p-CREB normalized to total CREB (n = 3). p value was calculated by Student’s t test.
(E) Left: Unsupervised hierarchical clustering (UHC) and heatmap of gene expression in SSC cultures with indicated treatments for 2 days. Right: Top GO enrichments with representative genes in each cluster. Rapamycin was used at 100 nM in DMSO. H89 was used at 1 μM in DMSO.
(F) UHC and heatmap for the expression of 165 early meiosis-associated genes with the indicated treatment for 2 days.
(G) Schematic model that shows chordate morphogen RA inducing meiosis by silencing nutrient transporter expression, which in turn elicits a conserved nutrient restriction signal that involves TORC1 and PKA.
See also Figure S6.
