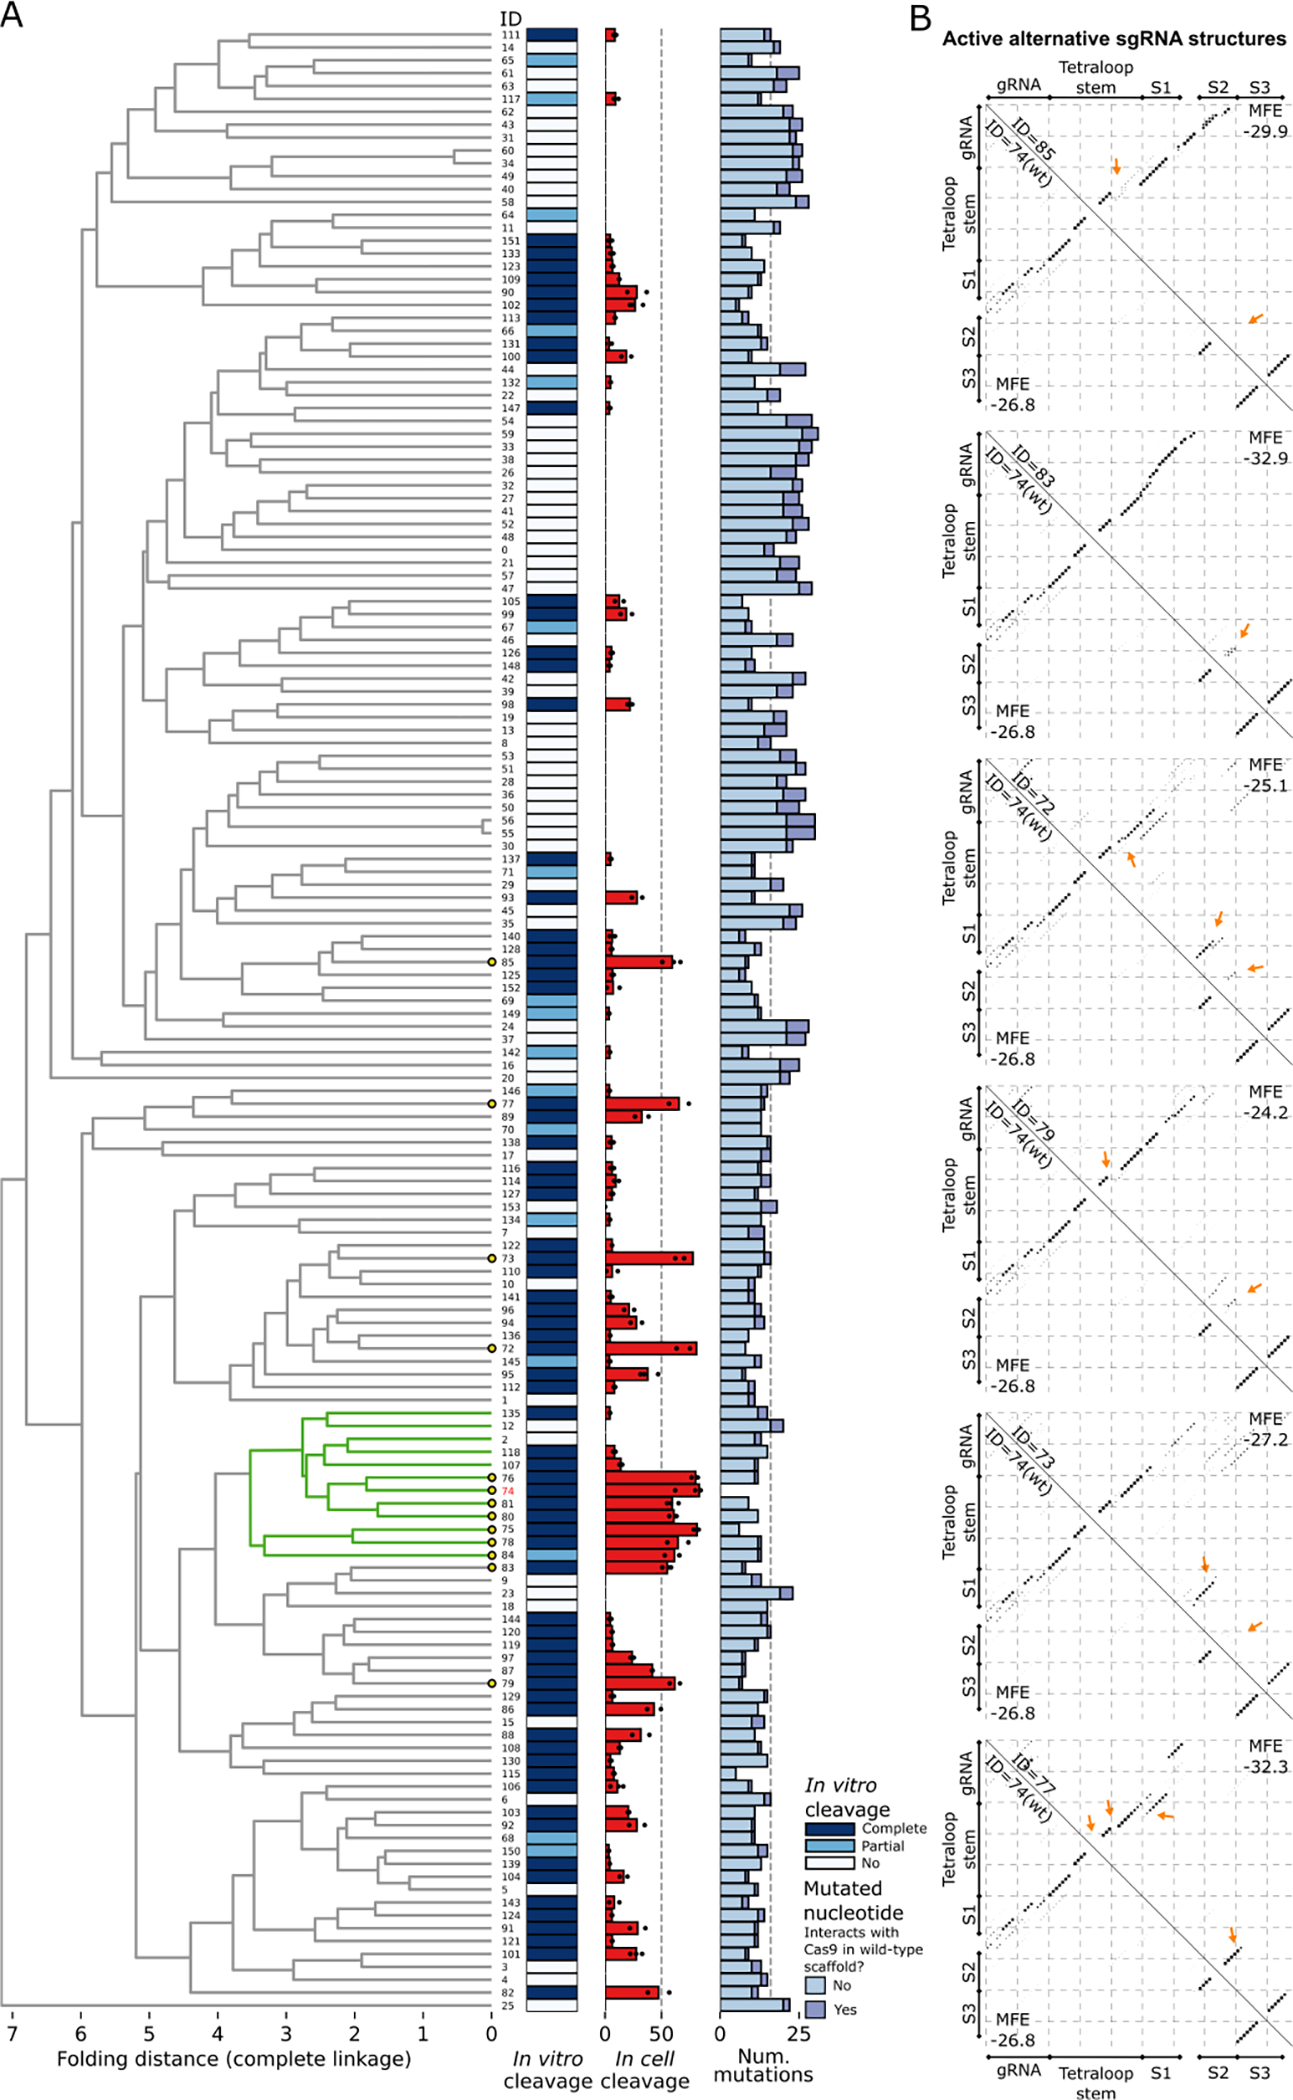
Figure 5. Structure-based clustering of sgRNA variants displaying a range of cleavage efficiencies in vitro and editing efficiencies in cells.

(A) Selected sgRNAs were clustered based on their structures, as described in the Methods. A subcluster with > 50% of its members having mean in cell editing efficiency ≥ 50% is colored in green (WT subcluster). Leaves representing sgRNAs with mean in cell editing efficiency ≥ 50% are highlighted by yellow circles. The in vitro cleavage efficiency of sgRNAs is shown with a colormap with Complete cleavage (> 50%) in dark blue and Partial cleavage (< 50%) in light blue. The mean in cell editing is shown as a barplot, with efficiencies obtained from each replicate scattered with dots. Absence of dots implies that the sgRNA was not tested in cell. The number of differences to the WT obtained from the aligned scaffold sequences is shown with a stacked barplot, which differentiates mutations based on their role in interacting with Cas9. (B) Base pairing probability matrices of alternative functional sgRNA structures (upper triangle) and of the WT sgRNA structure (bottom triangle) are displayed as dotplots. The sgRNA IDs, corresponding to the IDs in the clustering (A), are given along the diagonal. The Tetraloop Stem, Stem 1 (S1), Stem 2 (S2), and Stem 3 (S3) previously reported 34 are annotated for compatibility. Arrows point to the major changes between each sgRNA scaffold and the WT scaffold structure.
