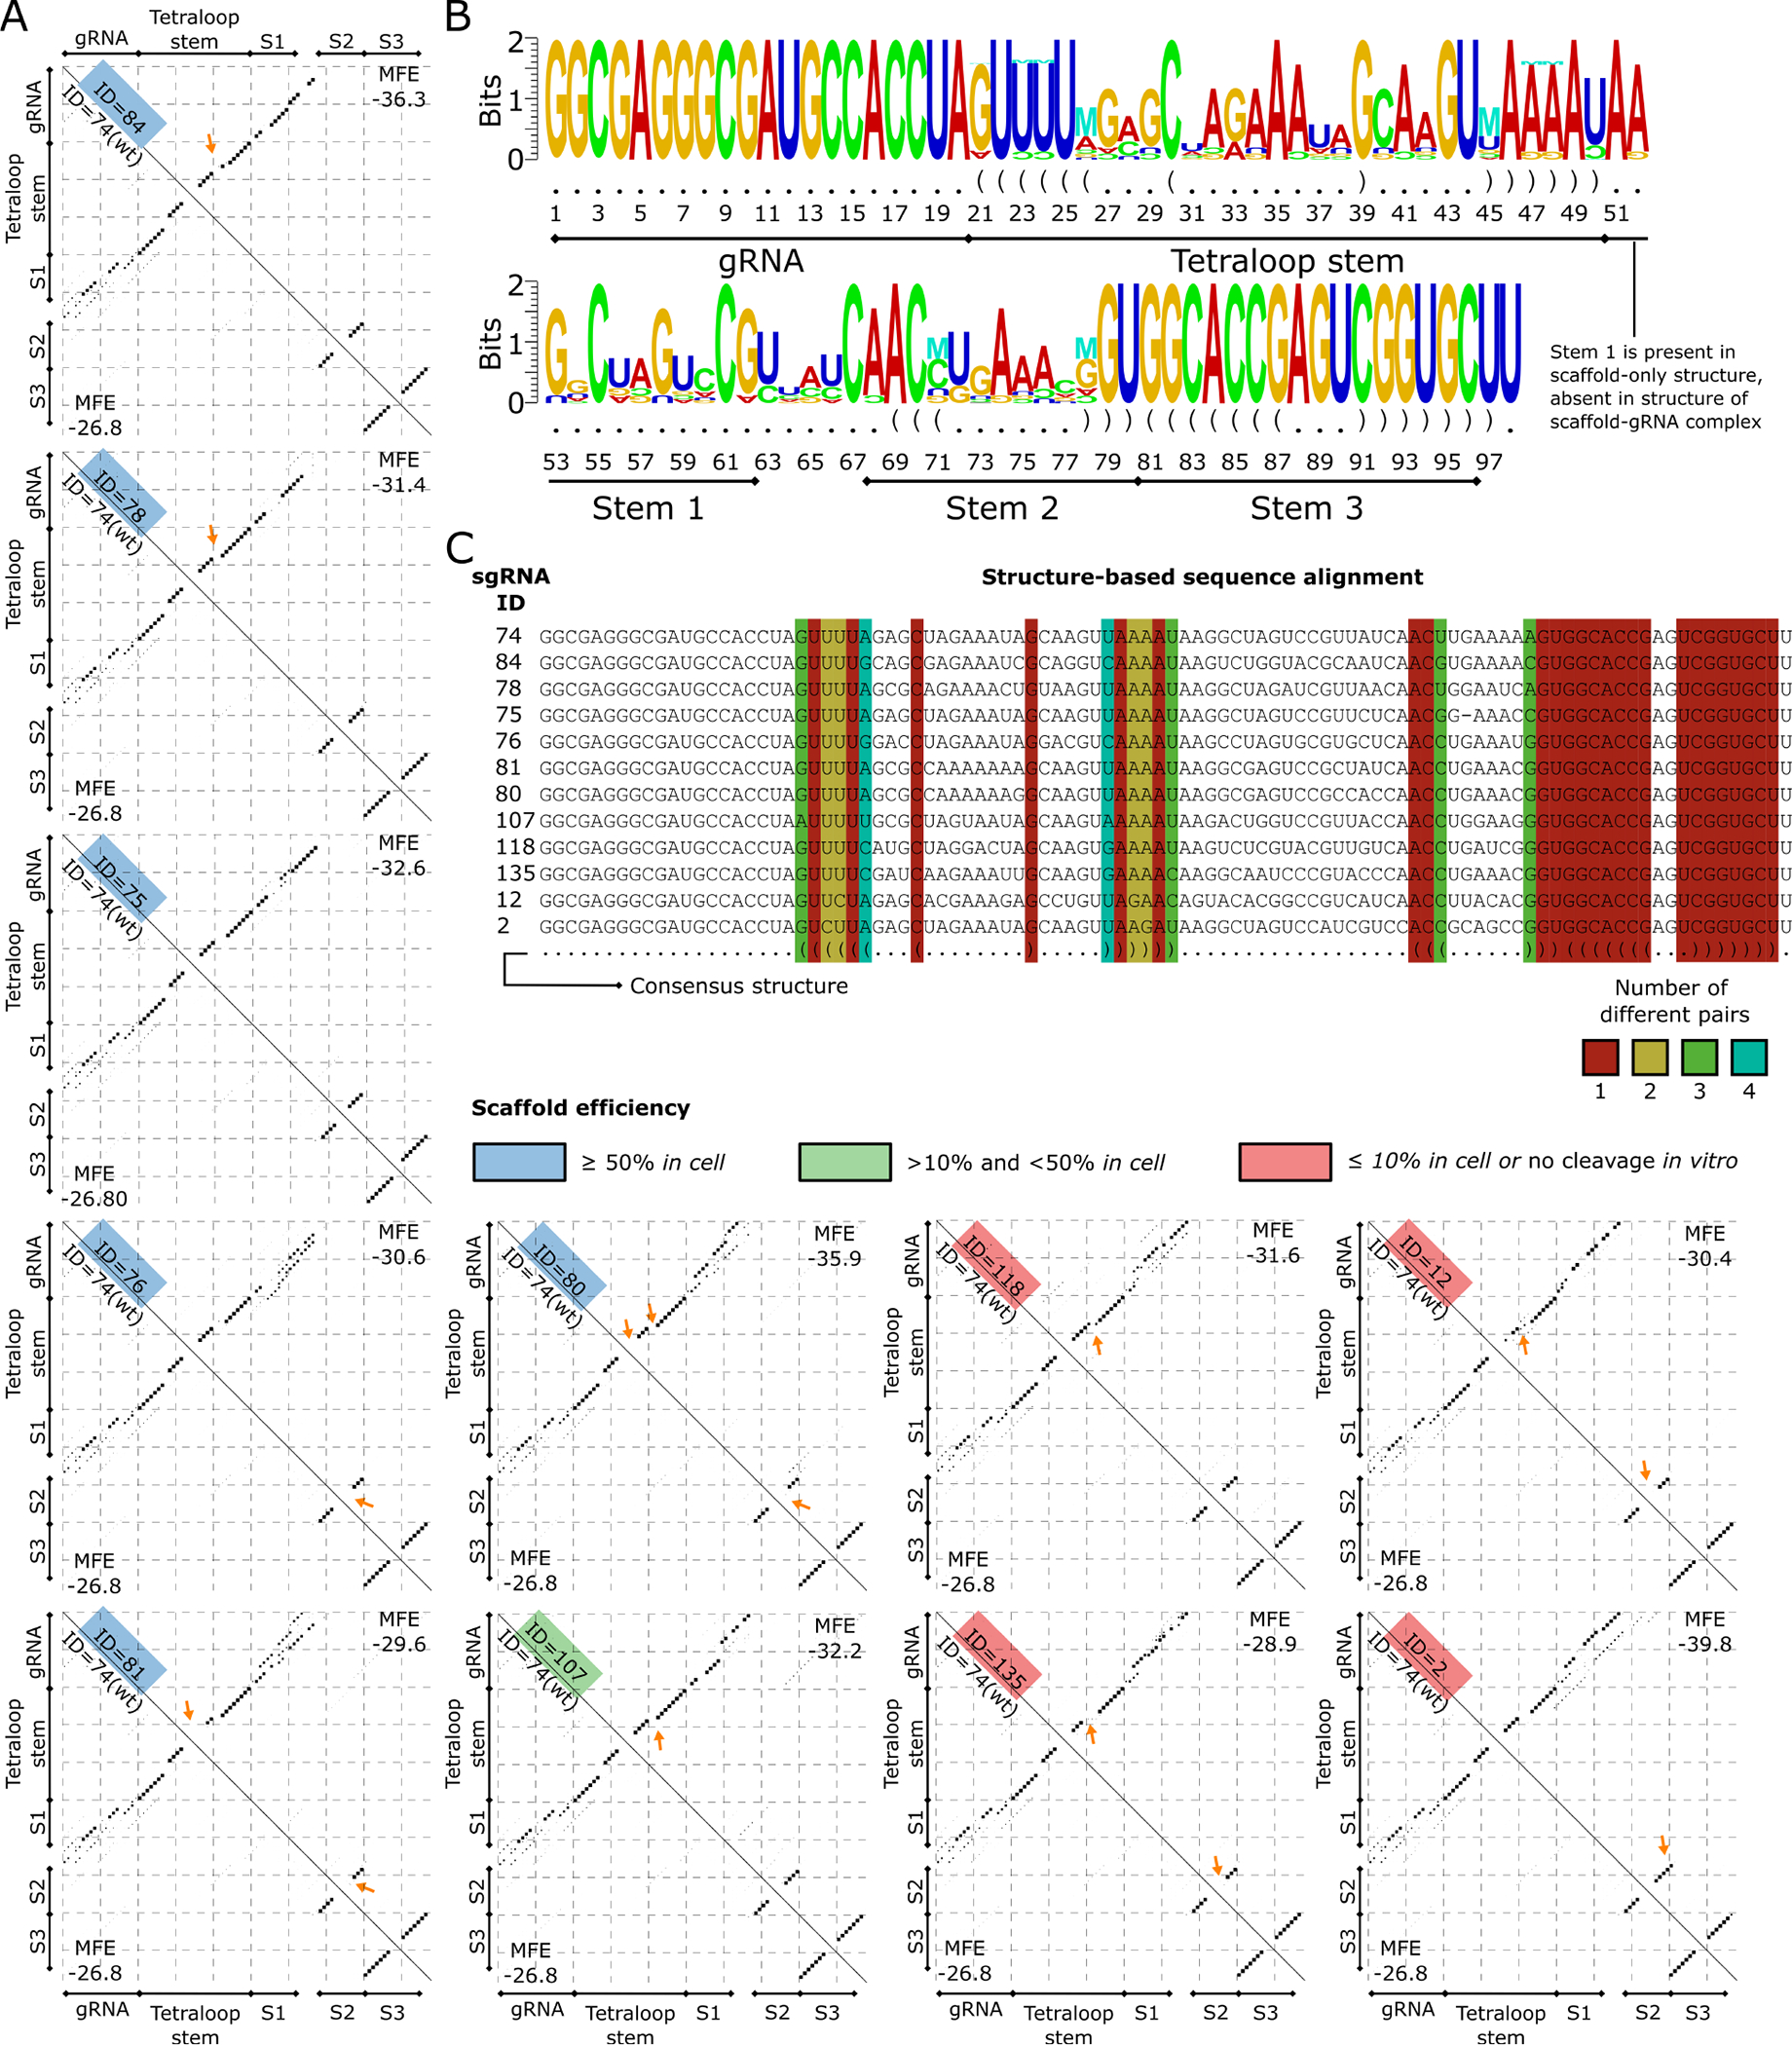
Figure 6. Structure differences between the members of the WT subcluster.

(A) Base pairing probability matrices of sgRNA structures that are part of the WT subcluster (upper triangle) and of the WT sgRNA structure (bottom triangle) are displayed as dotplots. The sgRNA IDs are given along the diagonal and colored based on the efficiency category (low ≤ 10%, medium between 10%, and 50%, high ≥ 50%). The Tetraloop Stem, Stem 1 (S1), Stem 2 (S2), and Stem 3 (S3) previously reported (34 are annotated for compatibility. Arrows point to the major changes between each sgRNA scaffold and the WT scaffold structure. (B) Structure logo of sgRNAs in the WT subcluster is shown. The structure logo annotates a sequence logo with mutual information of RNA base pairs, shown with the “M” symbol. Nucleotides that appear less than expected are shown upside down. (C) Structure-based sequence alignment of sgRNAs in the WT subcluster. The consensus structure is shown in the last row. Columns corresponding to base pairs in the consensus are colored based on the number of different base-pair types in the sequences.
