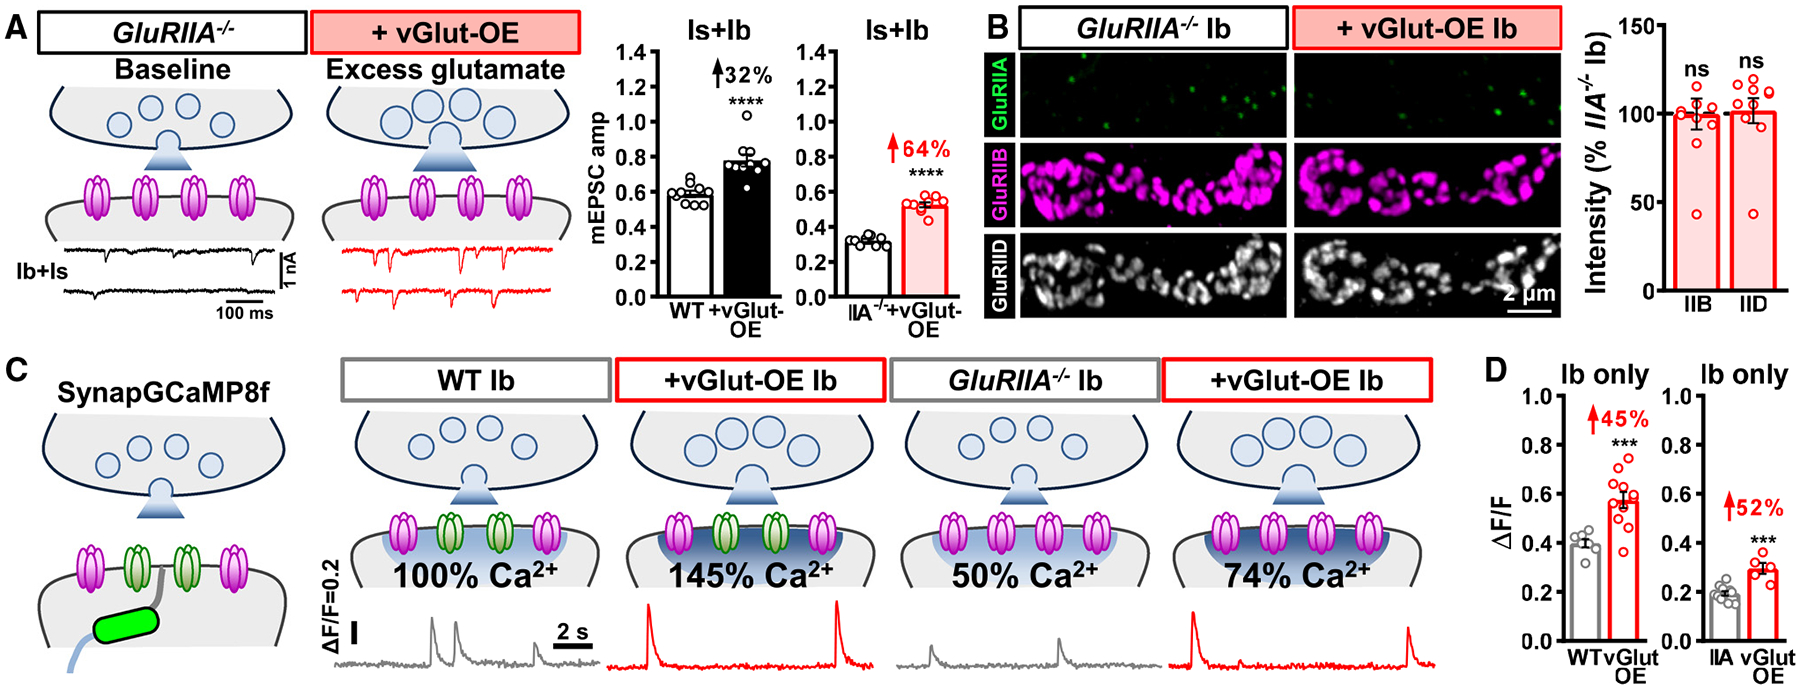
Figure 4. Excess glutamate does not adaptively downregulate GluRB in the absence of GluRA.

(A) Schematics and representative mEPSC traces of blended Is+Ib NMJs containing only GluRB receptors (GluRIIA−/−mutants: w;GluRIIApv3) at baseline and following vGlut-OE (GluRIIA+vGlut-OE: w;GluRIIApv3,UAS-vGlut/GluRIIApv3,OK371-Gal4). Right: quantification of mEPSC amplitude in the indicated genotypes; the percentage above indicates the increase observed compared to baseline (wild type or GluRIIA mutants). Note that mEPSC amplitude is enhanced by 64% in GluRIIA+vGlut-OE over GluRIIA mutants alone.
(B) Representative images of GluRs from MN-Ib NMJs immunostained in the indicated genotypes. Right: quantification of GluR mean fluorescence intensity in GluRIIA+vGlut-OE normalized to GluRIIA mutants alone. In the absence of GluRA receptors, excess glutamate release does not significantly change GluRB abundance.
(C) Schematics and representative quantal events using SynapGCaMP8f Ca2+ imaging at MN-Ib NMJs from the indicated genotypes. Note that quantal events are enhanced by 50% in vGlut-OE or GluRIIA−/−+vGlut-OE and reduced by ~50% in GluRIIA−/−, compared to baseline values (wild type or GluRIIA−/−), as expected.
(D) Quantification of average fluorescence intensity of quantal events in the indicated genotypes. Similar results are observed at MN-Is NMJs from the same genotypes (Figures S3C and S3D). Error bars indicate ±SEM, with the following statistical significance: ***p < 0.001, ****p < 0.0001; ns, not significant. Additional statistics and sample number values (n) for all experiments are summarized in Table S1.
