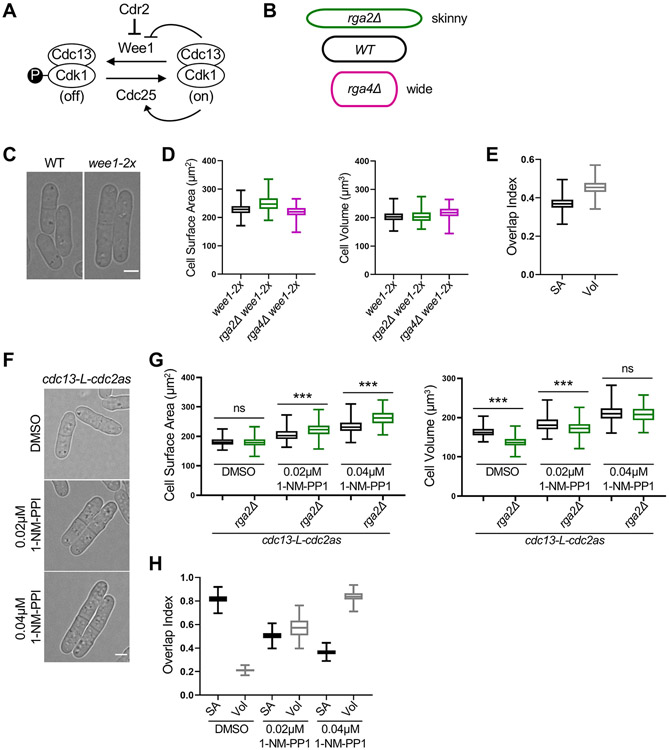
Figure 1. Large cells shift to volume-based division. See also Figure S1 and S2.
(A) Schematic of the pathway regulating mitotic entry and cell size. (B) Cartoon of cell width mutants used to uncouple cell surface area and volume. The colors apply to subsequent graphs in all figures. (C) Brightfield images of wild type (WT) and larger wee1-2x cells. (D) Size of dividing cells for indicated strains plotted by surface area (left) or volume (right). wee1-2x, n=628; wee1-2x rga2Δ, n=227; wee1-2x rga4Δ, n=197. (E) Overlap index analysis for data in panel D. SA, surface area. Vol, volume. (F) Brightfield images of cdc13-L-cdc2as treated with the indicated concentrations of 1-NM-PP1 or DMSO control. cdc13-L-cdc2as: DMSO n=686, 0.02μM 1-NM-PP1 n=424, 0.04μM 1-NM-PP1 n=470; cdc13-L-cdc2as rga2Δ: DMSO n=866, 0.02μM 1-NM-PP1 n=474, 0.04μM 1-NM-PP1 n=486) (G) Size of dividing cells for indicated strains plotted by surface area (left) or volume (right). ns, not significant; ***p<0.0001. (H) Overlap analysis for data in panel G. Graphs show median as a line, quartiles, max, and min. Bars, 4μm. See also Figures S1, and S2.

