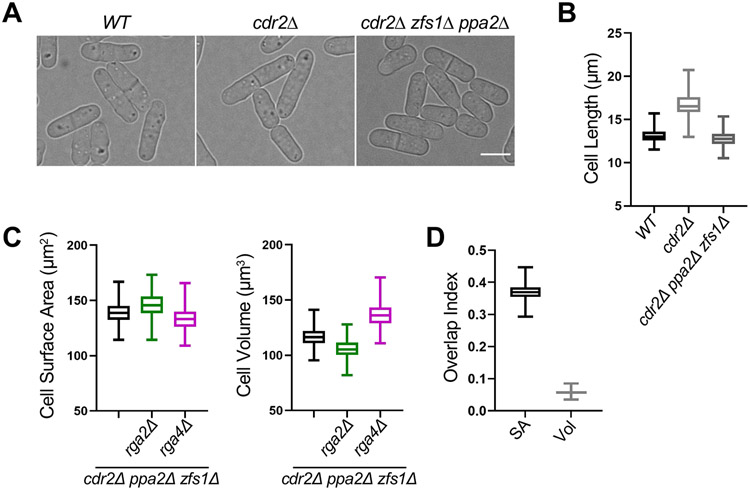
Figure 2. Reducing the size of cdr2Δ cells restores surface area-based divisions. See also Figure S2.
(A) Brightfield images of WT, cdr2Δ, and cdr2Δ zfs1Δ ppa2Δ cells. Bar, 4μm. (B) Cell length at division (μm) of indicated cell types. WT, n=268; cdr2Δ, n=590; and cdr2Δ zfs1Δ ppa2Δ, n=461. (C) Size of dividing cells for indicated strains plotted by surface area (left) or volume (right). cdr2Δ zfs1Δ ppa2Δ, n=461; cdr2Δ zfs1Δ ppa2Δ rga2Δ, n=415; and cdr2Δ zfs1Δ ppa2Δ rga4Δ, n=739. (D) Overlap index analysis for data in panel C. Experiment was repeated in triplicate and representative graphs from one experiment are shown. SA, surface area. Vol, volume. Graphs show median as a line, quartiles, max, and min. See also Figure S2.

