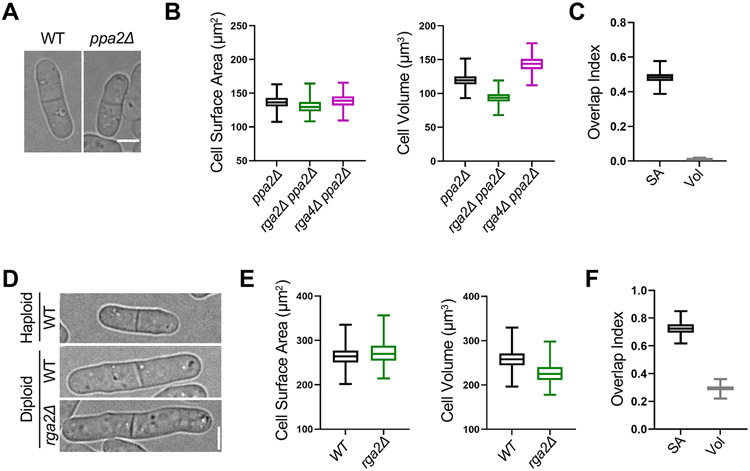
Figure 3. Small size mutants and diploid cells retain surface area-based divisions. See also Figure S2.
(A) Brightfield images of WT and small ppa2Δ cells. (B) Size of dividing cells for indicated strains plotted by surface area (left) or volume (right). ppa2Δ, n=294; ppa2Δ rga2Δ, n=422; and ppa2Δ rga4Δ, n=365. (C) Overlap index analysis for data in panel B. SA, surface area. Vol, volume. Experiment was repeated in triplicate and representative graphs from one experiment are shown. (D) Brightfield images of indicated strains. (E) Size of dividing cells for indicated strains plotted by surface area (left) or volume (right). WT diploid, n=525 and rga2Δ diploid, n=397. We were unable to generate a rga4Δ diploid. (F) Overlap index analysis for data in panel E. Experiment was repeated in triplicate and representative graphs from one experiment are shown. Graphs show median as a line, quartiles, max, and min. Bars, 4μm. See also Figure S2.

