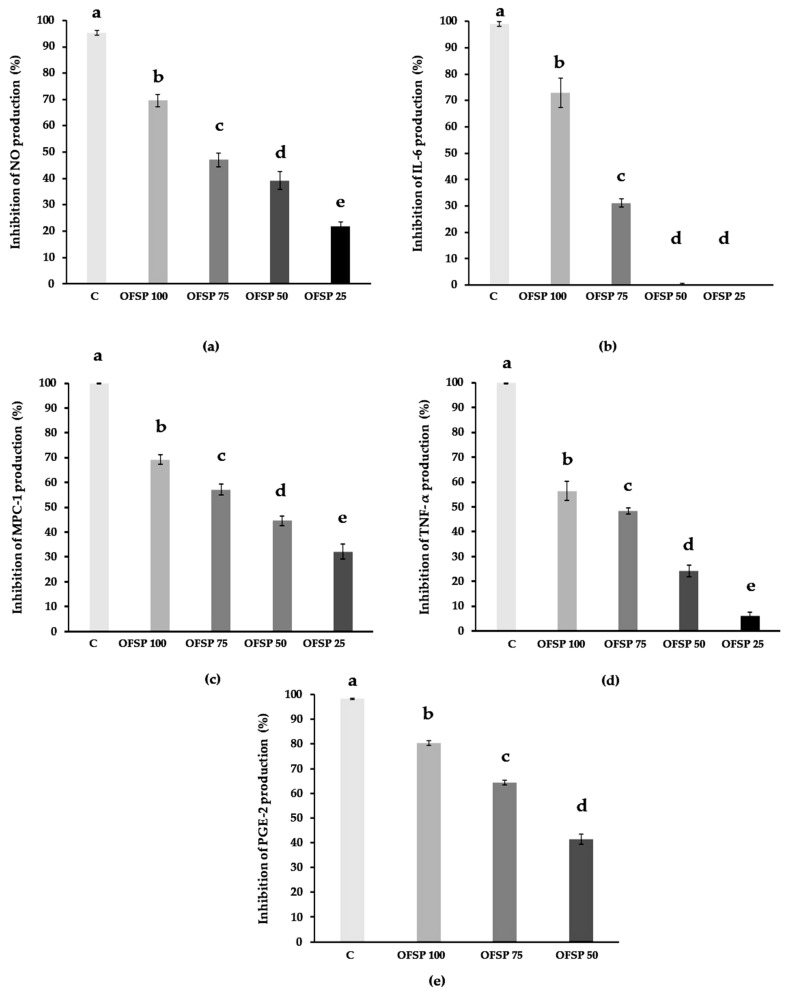
Figure 1.
Effect of OFSP flour extract at different concentrations (100, 75, 50, and 25 µg/mL) on NO production (a) and on the production of proinflammatory cytokines IL-6 (b), MPC-1 (c), TNF-alpha (d), and PGE-2 (e) by J 774 inflammatory macrophages. Histogram bar “C” represents the control value, i.e., macrophage production of NO or cytokine, induced by lipopolysaccharide and interferon-gamma without pre-treatment by OFSP flour extracts. Values measured by Griess/Elisa reagent are expressed as the mean of the percentage inhibition plus or minus the standard deviation (n = 3) (a, b, c, d, and e; p < 0.05).

