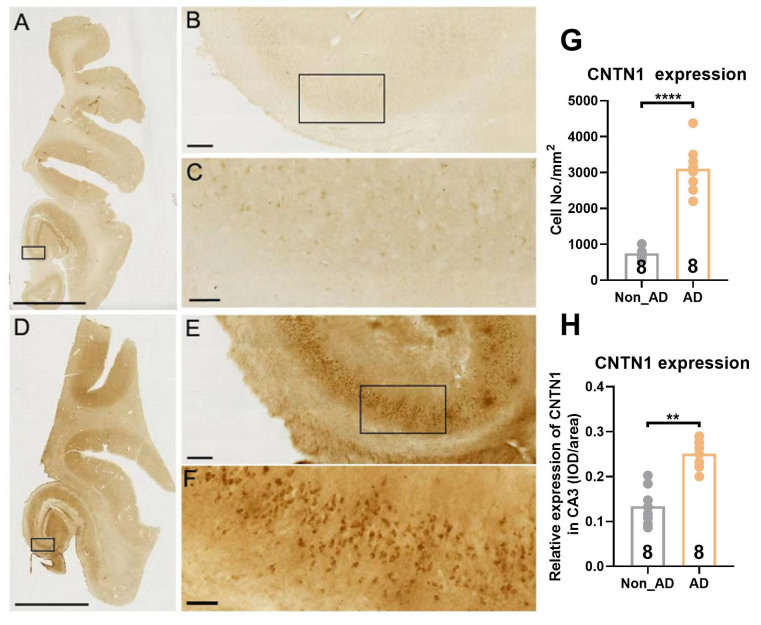
Figure 1.
CNTN1 expression was increased in the hippocampus of AD postmortem brain relative to non-AD control. (A-F) Representative images of CNTN1 expression in hippocampal subregions at different magnifications in non-AD controls (A-C) and AD postmortem brains (D-F). Immunohistochemistry (IHC) was done on frozen sections of OCT embedded hippocampus. (G) Quantitative analysis of CNTN1 expression in hippocampus by number of non-AD control and AD postmortem brain. (H) Quantitative analysis of CNTN1 expression in hippocampus by integrated optical density (IOD) of non-AD control and AD postmortem brain. Data were analyzed by unpaired two-tailed Student’s t test. Data were presented as mean ± sem. **p < 0.01, compared with control group. Scale Bar: A&D: 8 mm; B&E: 300 μm; C&F: 60 μm.

