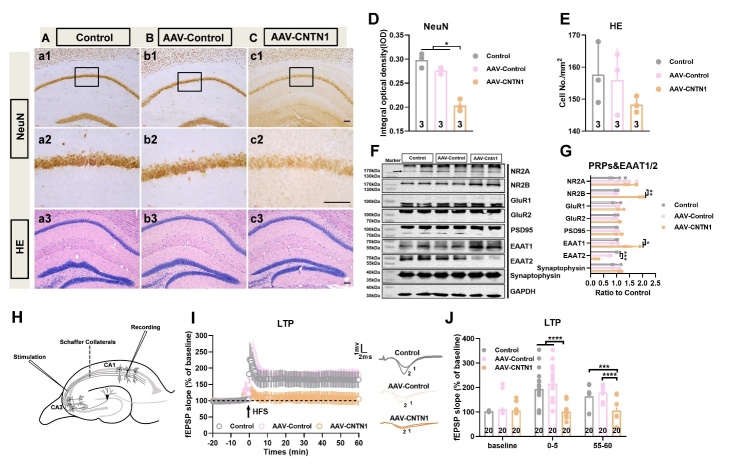
Figure 4.
Hippocampal CNTN1 overexpression induced impairment of LTP at Schaffer collateral-CA1 synapses. (A-C) Representative images showed immunostaining against neuronal marker NeuN at low magnification of brain sections in hippocampus of mice in different groups (a1-c1. (A-C&D) Representative images showed immunostaining against neuronal marker NeuN (a2-c2) and quantitative analysis at high magnification of brain sections (D) in hippocampus of mice in different groups. (A-C&E) Representative images showed HE staining (a3-c3) and quantitative analysis on brain sections (E) in hippocampus of mice in different groups. (F&G) Representative immunoblots (F) and quantitative analyses of PRPs, EAAT1 and EAAT2 expression (G) in hippocampus in different groups. n=4 per group. (H) Schematic position of the stimulus electrode and recording electrode in the dorsal hippocampal slices in mice. Recording electrode positioned in CA1 apical dendrites was performed by stimulating electrodes to stimulate schaeffer collateral inputs. (J&K) Representative images (I) and Quantitative analysis (J) showed the time-course of the fEPSP slope recorded from the hippocampal Schaeffer collateral-CA1 (Sch/CA1) synapses in different groups. The traces adjacent to the panel were the field EPSPs at the times indicated on the panel in different groups. Trace1 showed pre HFS, Trace 2 showed post HFS. Data in Fig. 4D, E and G were analyzed by Kruskal-Wallis statistical test; Data in Fig. 4J were analyzed by one-way ANOVA followed by Bonferroni’s multiple comparison tests. Data were presented as mean ± sem. *p < 0.05, **p < 0.01,***p < 0.001 and ****p < 0.0001. Scale bar: 50 μm.

