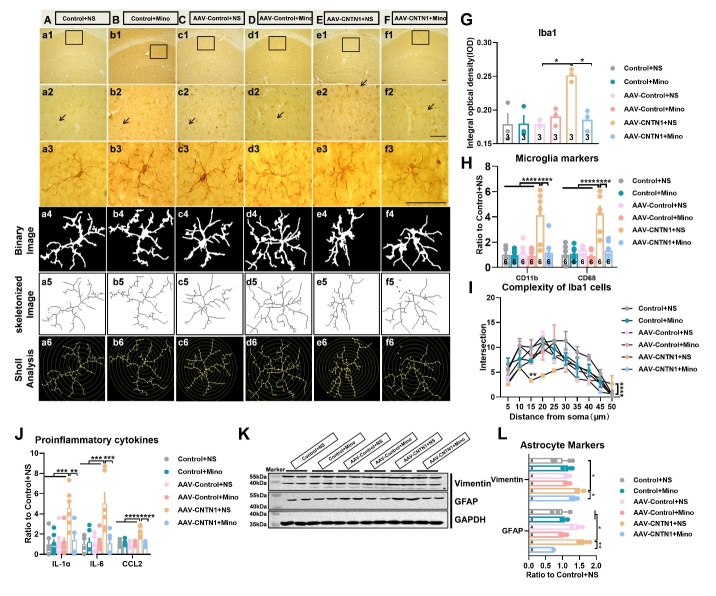
Figure 5.
Minocycline inhibited microglia activation and the following astrocyte activation induced by hippocampal CNTN1 overexpression. (A-F) Representative images showed immunostaining against microglial marker Iba1 on brain sections in hippocampus of mice in different groups. (G) Quantiative analysis of Iba1 positive microglia in hippocampus of mice in different groups by integrated optical density (IOD). (H) Quantitative real time qPCR detection of mRNA expression of CD11b and CD68 in hippocampus. (I) Quantitative analyses of complexity with Iba1 positive microglia in hippocampus in different groups. (J) Quantitative real time qPCR detection of mRNA expression of IL1α, IL6 and CCL2 in hippocampus in different groups. n=6 per group. (K&L) Representative immunoblots (K) and quantitative analyses (L) of vimentin and GFAP expression in hippocampus in different groups. Data in Fig. 5G, and L were analyzed by Kruskal-Wallis statistical test; Data in Fig 5. I was analyzed by two-way ANOVA followed by Bonferroni’s multiple comparison tests. Data in Fig. 5H, I and J were analyzed by one-way ANOVA followed by Bonferroni’s multiple comparison tests. Data were presented as mean ± sem. *p < 0.05, **p < 0.01,***p < 0.001 and ****p < 0.0001. NS: Saline. Scale bar: 50 μm.

