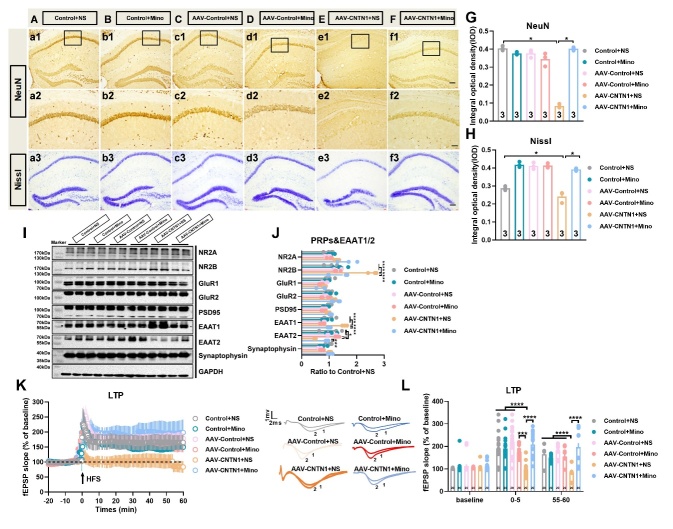
Figure 7.
Minocycline mitigated impairment of LTP induced by CNTN1 overexpression in hippocampus. (A-F) Representative images showed NeuN expression in hippocampus at low magnification in different groups (a1-f1). (A-F&G) Representative images (a2-f2) and quantitative analysis of NeuN expression (G) at high magnification of CA1 subregion in different groups. (A-F&H) Hippocampal Nissl staining (a3-f3) and quantitative analysis (H) in different groups. (I&J) Representative immunoblots (I) and quantitative analyses (J) of PRPs and EAATs expression in hippocampus in different groups. n=4 per group. (K) Representative images showed the time-course of the fEPSP slope recorded from the hippocampal Schaeffer collateral-CA1 (Sch/CA1) synapses in different groups. The traces adjacent to the panel were the field EPSPs at the times indicated on the panel in different groups. Trace1 showed pre HFS, Trace 2 showed post HFS. Data in Fig. 7G, and H were analyzed by Kruskal-Wallis statistical test; Data in Fig.7J, K and L were analyzed by one-way ANOVA followed by Bonferroni’s multiple comparison tests. Data were presented as mean ± sem.*p < 0.05, ***p < 0.001 and ****p < 0.0001. Scale bar: 50 μm

