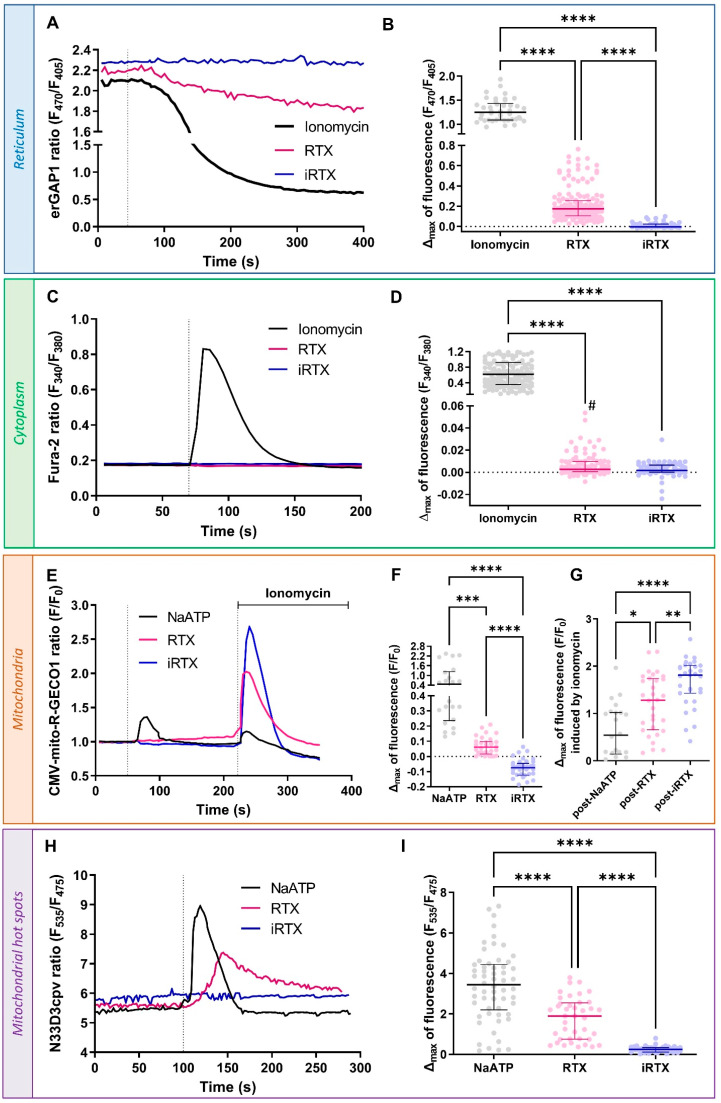
Figure 2.
Acute effect of TRPV1 modulation on Ca2+ homeostasis. (A,B) Reticular Ca2+ concentration ([Ca2+]r). (A) Time traces showing [Ca2+]r measured with erGAP1 probe during ionomycin (1 µM; black line), resiniferatoxin (RTX) stimulation (10 µM; pink line), or 5′-iodoresiniferatoxin (iRTX) stimulation (10 µM; blue line). (B) Scatter plots representing reticular Ca2+ content assessed by ionomycin (1 µM; black; n = 156), RTX (10 µM; pink; n = 69), or iRTX (10 µM; blue; n = 42) stimulation. (C,D) Cytosolic Ca2+ concentration ([Ca2+]c). (C) Time traces showing [Ca2+]c measured with Fura-2 AM probe during ionomycin (1 µM; black line), RTX (10 µM; pink line), or iRTX (10 µM; blue line) stimulation. (D) Scatter plots representing cytosolic Ca2+ content assessed by ionomycin (1 µM; black; n = 156), RTX (10 µM; pink; n = 105), or iRTX (10 µM; blue; n = 74) stimulation. (E–G) Mitochondrial Ca2+ concentration ([Ca2+]m). (E) Time traces showing [Ca2+]m measured with CMV-mito-R-GECO1 probe during NaATP (100 µM; black line), RTX (10 µM; pink line), or iRTX (10 µM; blue line) stimulation. (F) Scatter plots representing mitochondrial Ca2+ content assessed by NaATP (100 µM; black; n = 21), RTX (10 µM; pink; n = 32), or iRTX (10 µM; blue; n = 31) stimulation. (G) Scatter plots representing mitochondrial total Ca2+ content assessed by ionomycin (1 µM) after NaATP (black; n = 21), RTX (pink; n = 32), or iRTX (blue; n = 31) stimulation. (H,I) Ca2+ concentration in mitochondrial hot spots ([Ca2+]hot spots). (H) Time traces showing [Ca2+]hot spots measured with N33D3cpv probe during RTX (10 µM; pink line), iRTX (10 µM; blue line), or NaATP (100 µM; black line) stimulation. (I) Scatter plots representing Ca2+ content in mitochondrial hot spots assessed by NaATP (100 µM; black; n = 58), RTX (10 µM; pink; n= 40), or iRTX (10 µM; blue; n = 43) stimulation. Data are from at least three independent experiments. Statistics: * p < 0.05, ** p < 0.01, *** p < 0.001, **** p < 0.0001; # p < 0.05, RTX vs. iRTX Mann–Whitney test.

