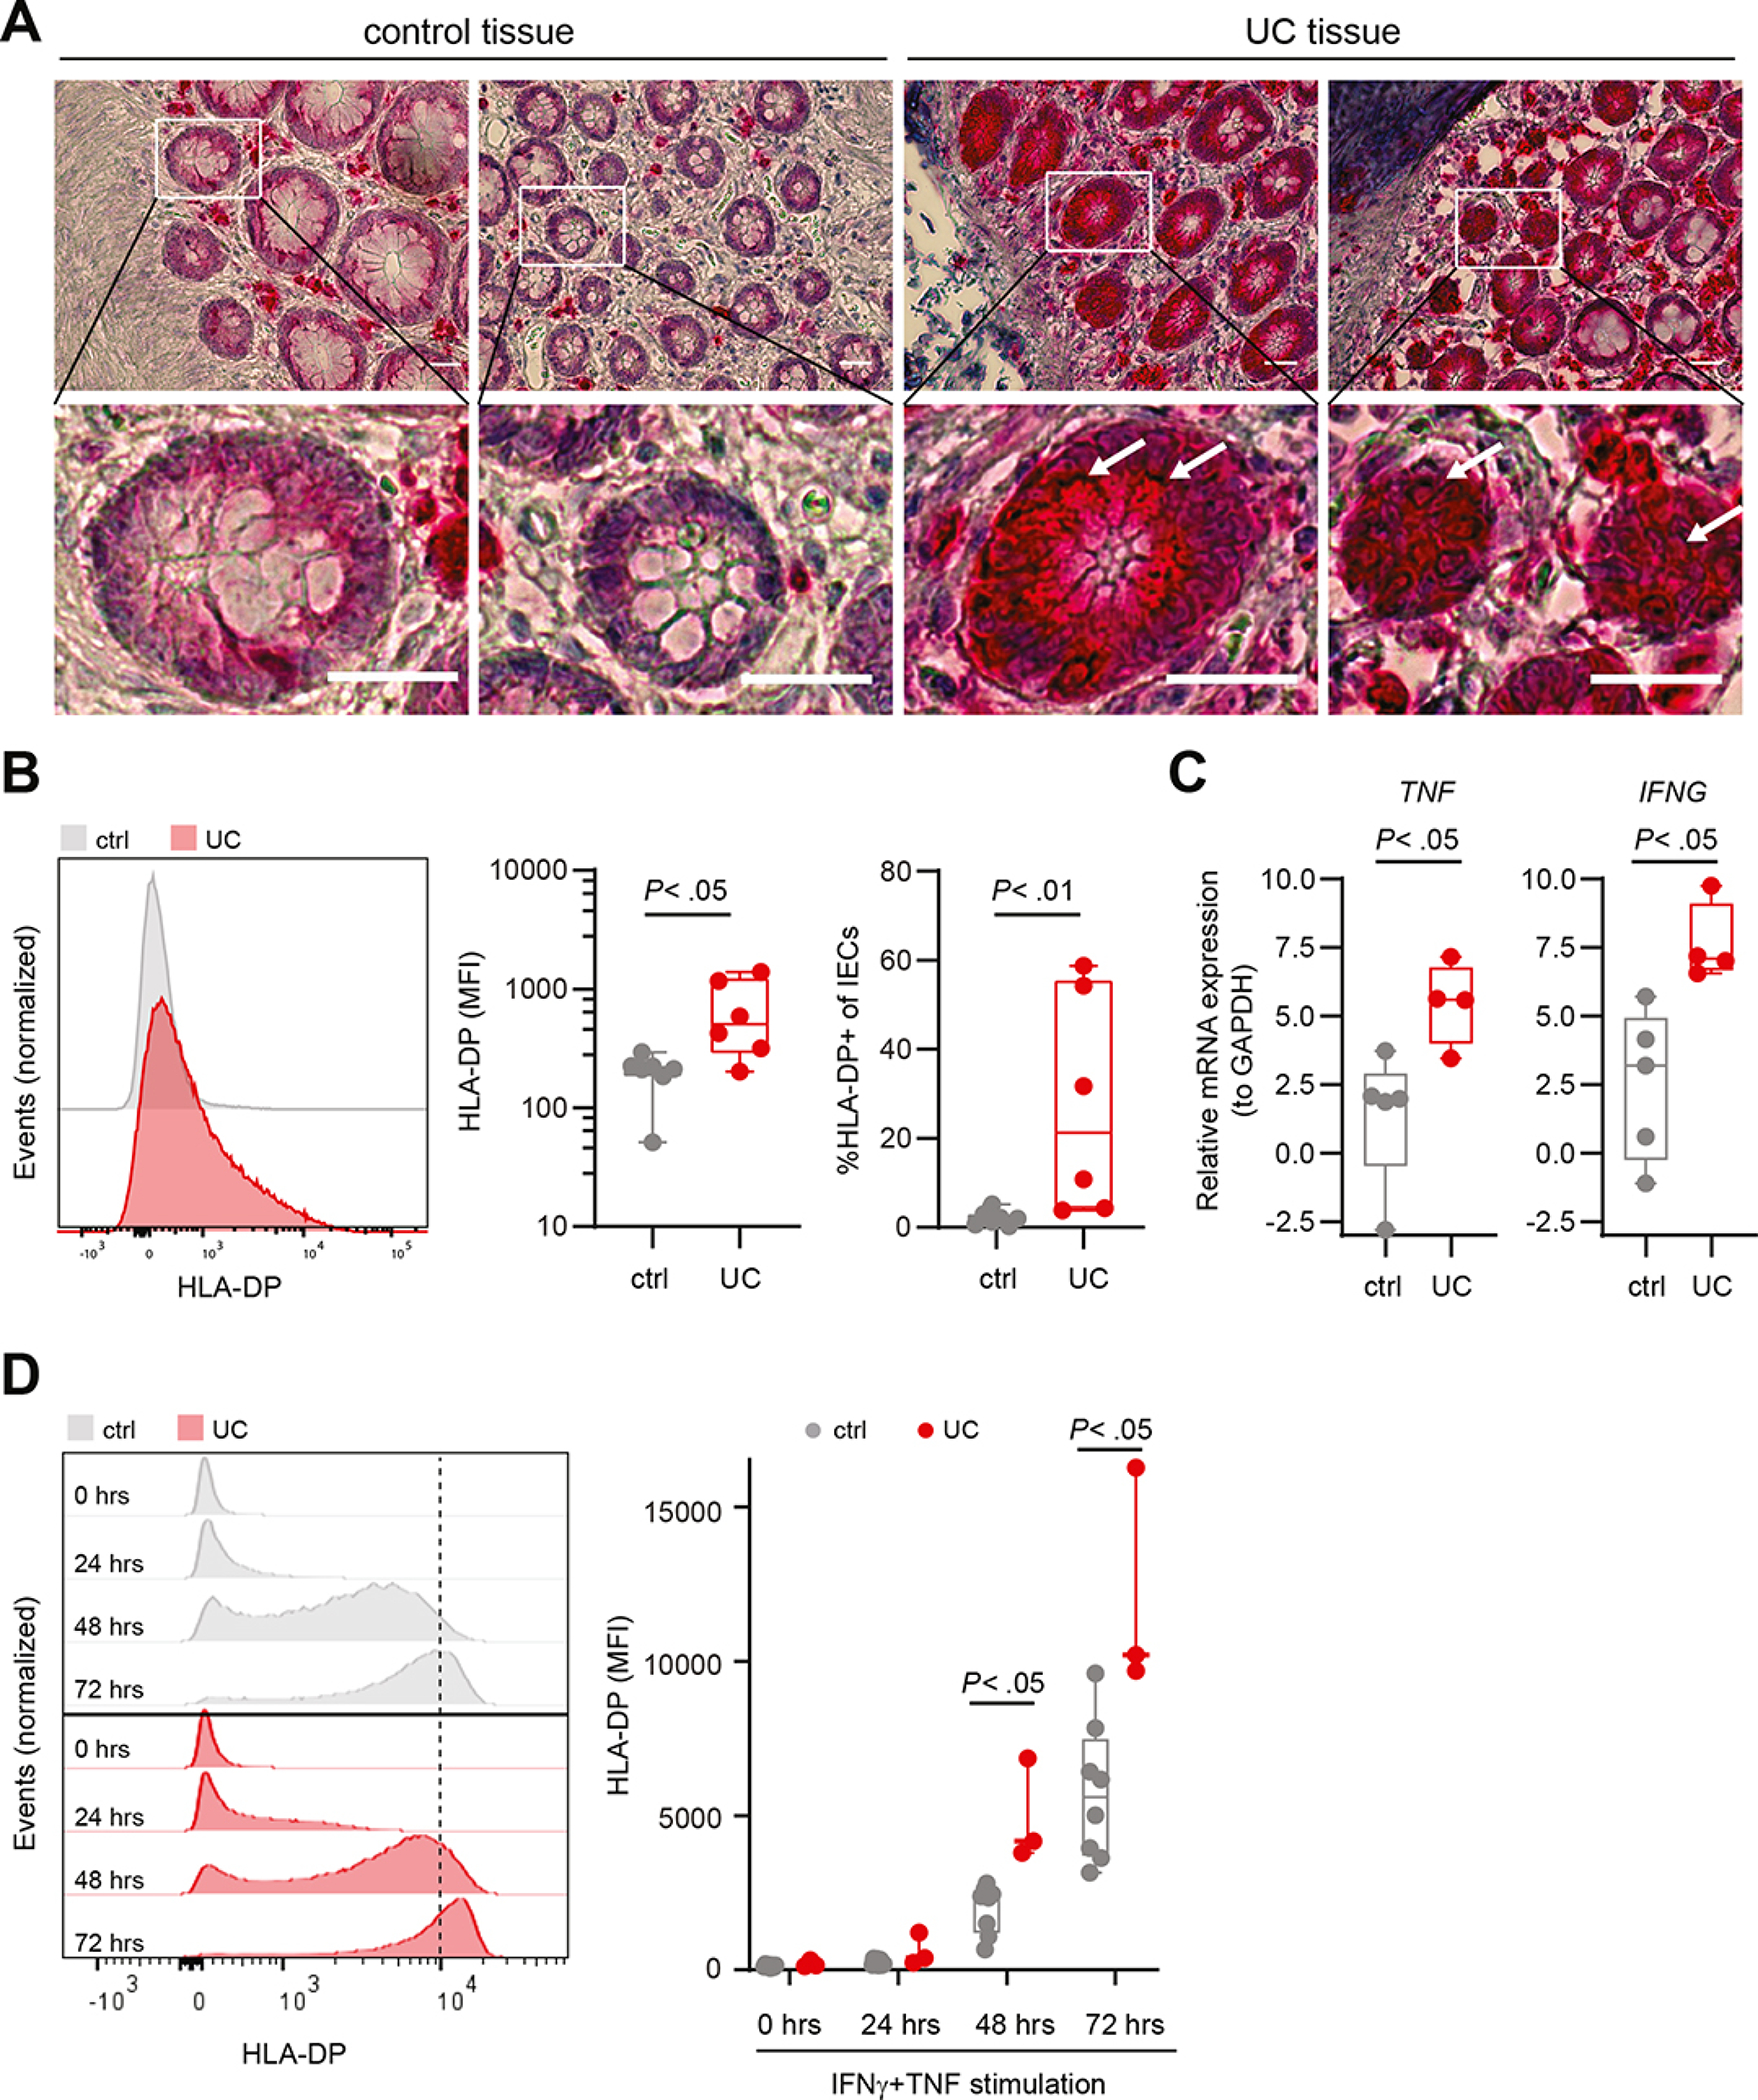
Figure 2: High HLA-DP expression on intestinal epithelial cells of individuals with UC.

A. Images of immunohistochemical analyses of control and UC colons. Specific HLA-DP expression is labelled in red, hemalumn was used as a nuclear counterstain (blue). Lower row shows magnifications of the selected ROI (white box in images of upper row). White arrows point to HLA-DP expressing cells. Scale bars: 250 μm. B. Representative histograms of HLA-DP expression in EpCAM+ IECs of control (ctrl) and individuals with UC measured by flow cytometry (left panel). Expression of HLA-DP (MFI) on EpCAM+ IECs (middle panel). Median percentage of HLA-DP+ cells of EpCAM+ IECs of controls (n = 7) and individuals with UC (n = 6) (right panel). C. Relative mRNA expression of TNF and IFNG to reference gene GAPDH in the intestinal epithelium of individuals with UC (n = 4) compared to controls (n = 5). D. Representative histograms of HLA-DP expression in EpCAM+ epithelial cells in organoids derived from controls or individuals with UC upon stimulation with IFNγ (100 U/ml) and TNF (20 ng/ml) for the indicated time points measured by flow cytometry (left panel). Plot shows MFI of HLA-DP on IECs in intestinal organoids of controls (n = 8) and individuals with UC (n = 3) upon IFNγ and TNF stimulation (right panel).
All boxes indicate medians with 25% and 75% quartile ranges, and whiskers indicate minimum and maximum values. Statistical significance was measured using Mann-Whitney U comparisons.
