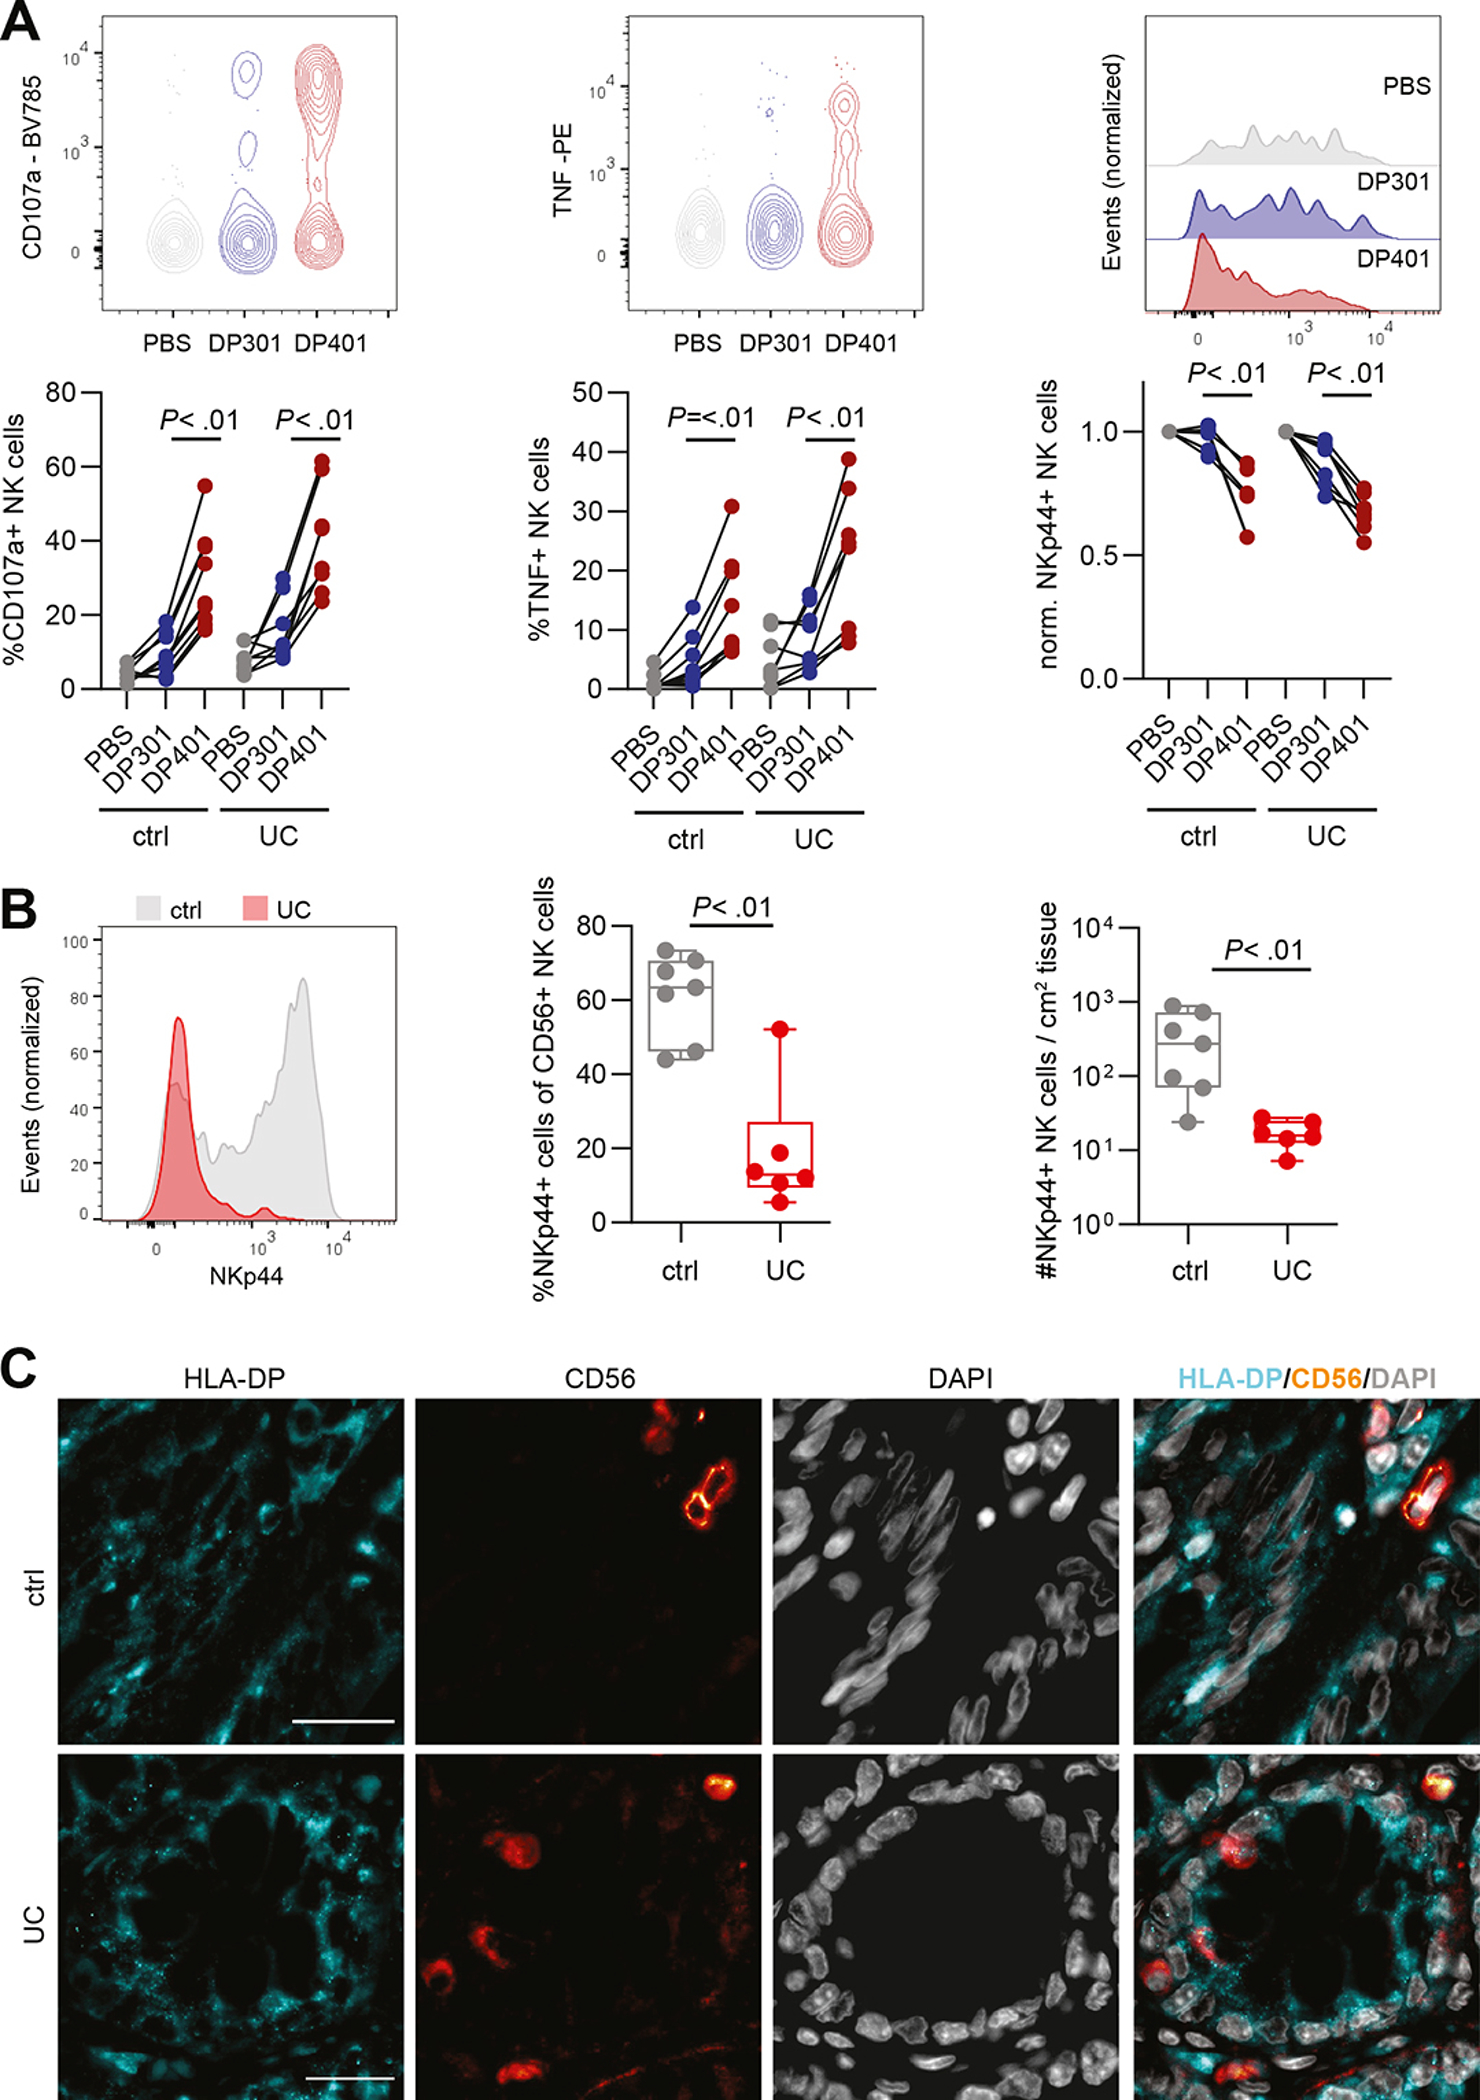
Figure 3: Increased activation and TNF production by NK cells of individuals with UC after engagement with HLA-DP401.

A. Representative flow plots for CD107a and TNF, representative histograms of NKp44 expression and summarized plots of peripheral blood-derived NK cells from controls and individuals with UC after incubation with PBS, HLA-DP301 and HLA-DP401 measured by flow cytometry. Each dot represents an individual donor and lines connect CD107a, TNF or NKp44 expression of one donor (ctrl: n = 9 replicates of 5 donors; UC: n = 8 replicates of 4 donors). B. Representative histograms of NKp44 expression on intestinal CD56+ NK cells in colon of non-inflammatory controls (ctrl) and individuals with UC (left panel) measured by flow cytometry. Median percentages of NKp44+ cells of CD56+ NK cells in non-inflammatory controls (n = 7) and individuals with UC (n = 6) (middle panel). Median counts of NKp44+ CD56+ NK cells per cm2 in control (n = 7) and UC-affected tissues (n = 6) (right panel). C. Representative single and merged fluorescence images of HLA-DP, CD56 and DAPI of control and UC-affected colon tissues. Scale bars: 20 μm.
All boxes indicate medians with 25% and 75% quartile ranges, and whiskers indicate minimum and maximum values. Statistical significance was measured using Wilcoxon signed rank tests (A) or Mann-Whitney U comparisons (B).
