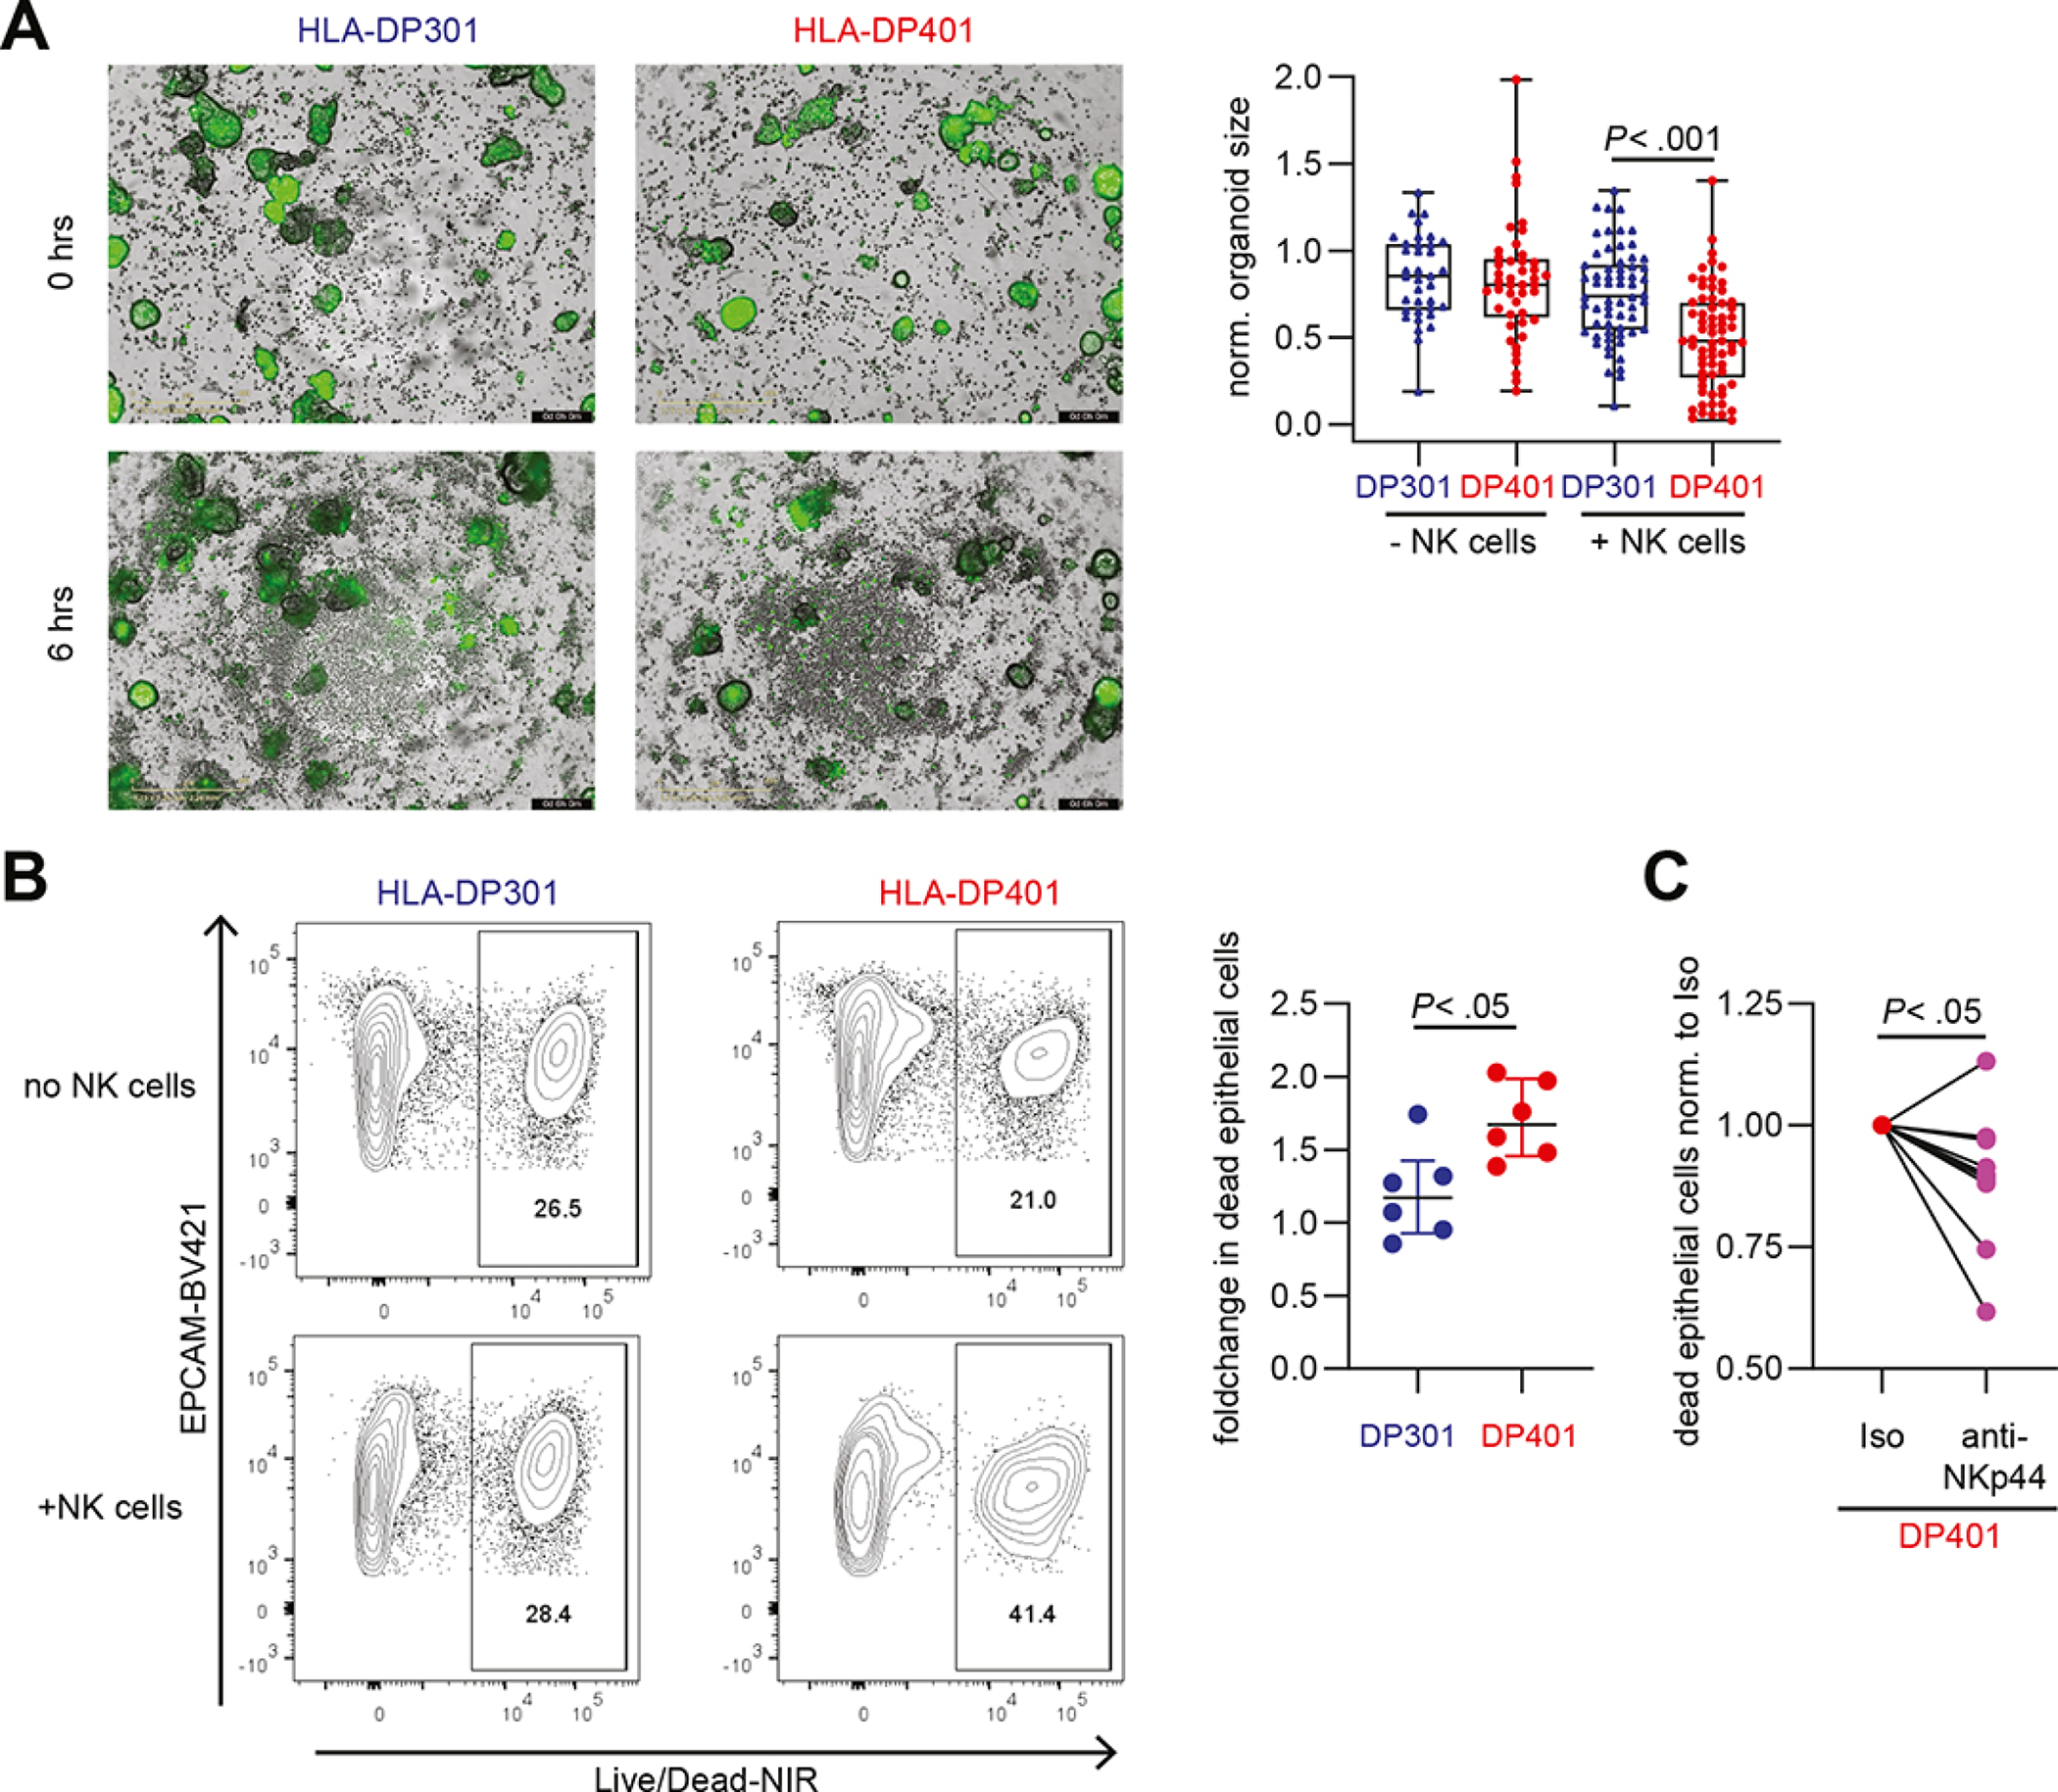
Figure 5: Expression of HLA-DP401 on IECs results in the induction of cytotoxicity by NK cells and reduces IECs viability.

A. Representative images of co-cultures of CD56++ NK cells with IFNγ-stimulated, Calcein-labelled (green) HLA-DP301- or HLA-DP401-expressing intestinal organoids at 0 hrs and 6 hrs (left panel). Plot shows normalized organoid size of HLA-DP301- and HLA-DP401-expressing intestinal organoids in presence or absence of CD56++ NK cells (n = 36–68 organoids per condition from experiments with 3 different NK cell donors). Scale Bars: 400 μm. B. Representative flow cytometric plots showing LIVE/DEAD™ Fixable Near-IR Dead Cell Stain of HLA-DP301+ or HLA-DP401+ EpCam+ IECs after incubation without NK cells or after co-culture with CD56++ NK cells. Plot shows fold change (normalized to dead IECs (LIVE/DEAD™ Fixable Near-IR Dead Cell Stain) without NK cells) in dead HLA-DP301+ or HLA-DP401+ IECs after co-culture with CD56++ NK cells (n = 6 replicates from 2 NK cell donors). C. Plot shows fold change in dead HLA-DP401+ IECs (LIVE/DEAD™ Fixable Near-IR Dead Cell Stain) after co-culture with CD56++ NK cells in presence of an isotype or anti-NKp44 blocking antibody (percentage of dead IECs upon culture with CD56++ NK cells in presence of an isotype antibody was set to 1 for each NK cell donor). Each dot represents an individual donor (n = 10 replicates from 5 NK cell donors) and lines connect one NK cell donor.
All boxes indicate medians with 25% and 75% quartile ranges, and whiskers indicate minimum and maximum values. Statistical significance was measured using Ordinary Two-way ANOVA (A), Mann-Whitney U comparisons (B) or Wilcoxon signed rank tests (C).
