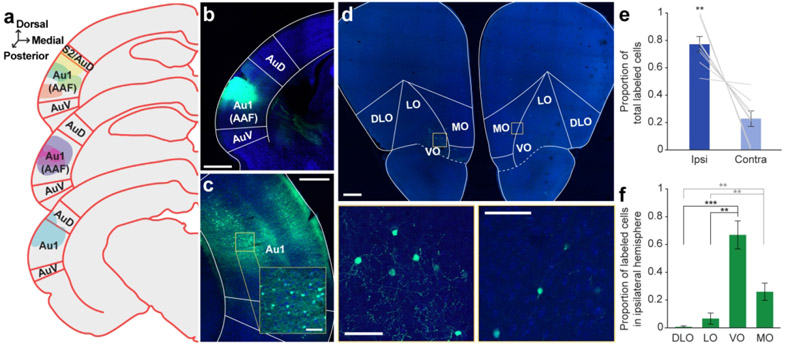
Figure 1. Retrograde tracer into Au1 reveals distinct profile of cell body labeling across the OFC mediolateral axis.
a. Schematic of all injection sites in Au1 (N = 8). Plate references from anterior to posterior: 29, 30, 32 (Radtke-Schuller et al., 2016). b. Injection site of representative subject. Scale bar = 1000 μm. c. In the same subject as B, expected labeling observed in the contralateral Au1. Scale bar = 500 μm, inset =100 μm. d. Representative OFC slice in the same subject as B. High magnification images depict cell bodies in the ipsilateral (left) and contralateral (right) hemispheres. Scale bar = 500 μm, high-mag = 100 μm. e. Proportion of total labeled cells in each hemisphere. Bars represent means ± standard error; lines connect data points from individual animals. f. Proportion of cell bodies within the ipsilateral hemisphere localized to each OFC subregion. Bars represent means ± standard error. **p<0.01, ***p<0.001.

