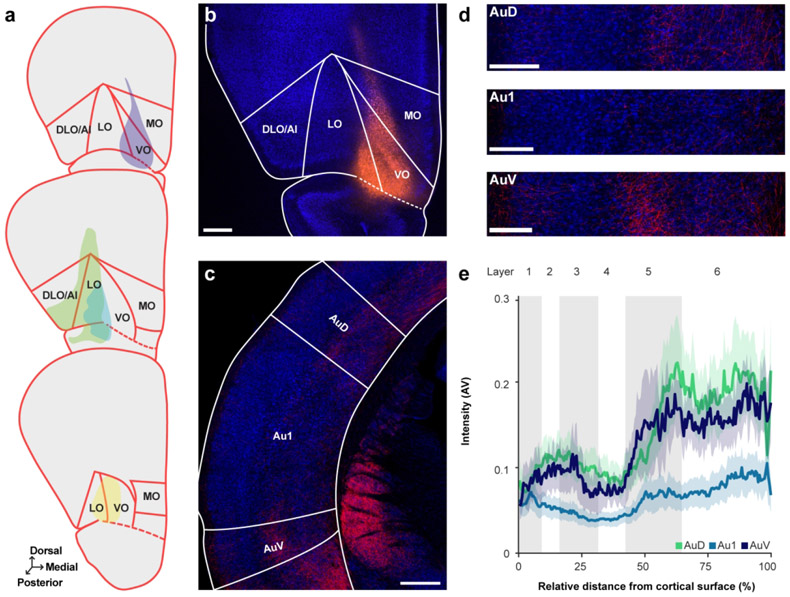
Figure 6. Anterograde tracer into OFC reveals region- and layer-specific innervation pattern in auditory cortex.
a. Schematic of all injection sites in OFC (N = 4). Plate references from anterior to posterior: 11, 12, 13 (Radtke-Schuller et al., 2016). b. Injection site of representative subject. Scale bar = 500 μm. c. Labeled terminals in the auditory cortex. Scale bar = 500 μm. d. From the same subject as in C, close-up images of terminals through AuD (top), Au1 (middle), and AuV (bottom). Scale bars = 250 μm. e. Normalized label intensity (arbitrary value, AV) for each subregion as a function of relative distance from the cortical surface. Lines represent means across animals; shading represents standard error.

