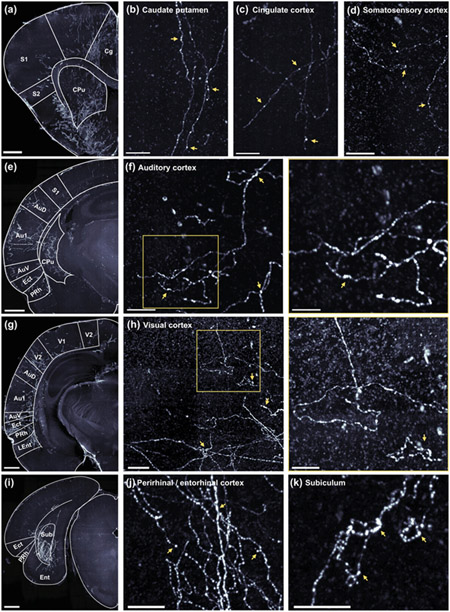
Figure 9. OFC neurons that project to auditory cortex exhibit synaptic boutons in many non-auditory brain regions.
a-d. Low magnification (a) and high magnification (b-d) images depicting labeled axon fibers in the anterior caudate putamen (b), cingulate cortex (c) and the somatosensory cortex (d). In b-d, scale bar = 100 μm. Here, and in all following panels, yellow arrows highlight likely synaptic boutons. e. Low magnification image depicting labeled axon fibers in the anterior auditory cortex, parahippocampal region, and caudate putamen. f. High magnification images depicting labeled axon fibers in the auditory cortex. Scale bars = 100 μm (left), and 50 μm (right). g. Low magnification image depicting labeled axon fibers in visual cortex, posterior auditory cortex, and the parahippocampal region. h. High magnification images depicting labeled axon fibers in the visual cortex. Scale bars = 100 μm (left), and 50 μm (right). I. Low magnification image depicting labeled axon fibers in the subiculum translational area. j-k. High magnification images depicting labeled axons fibers in the perirhinal and entorhinal cortices (j) and the subiculum (k). Scale bars = 50 μm. In panels a, e, g, and i, images are 175 μm thick coronal z-stacks with 1000 μm scale bars.

