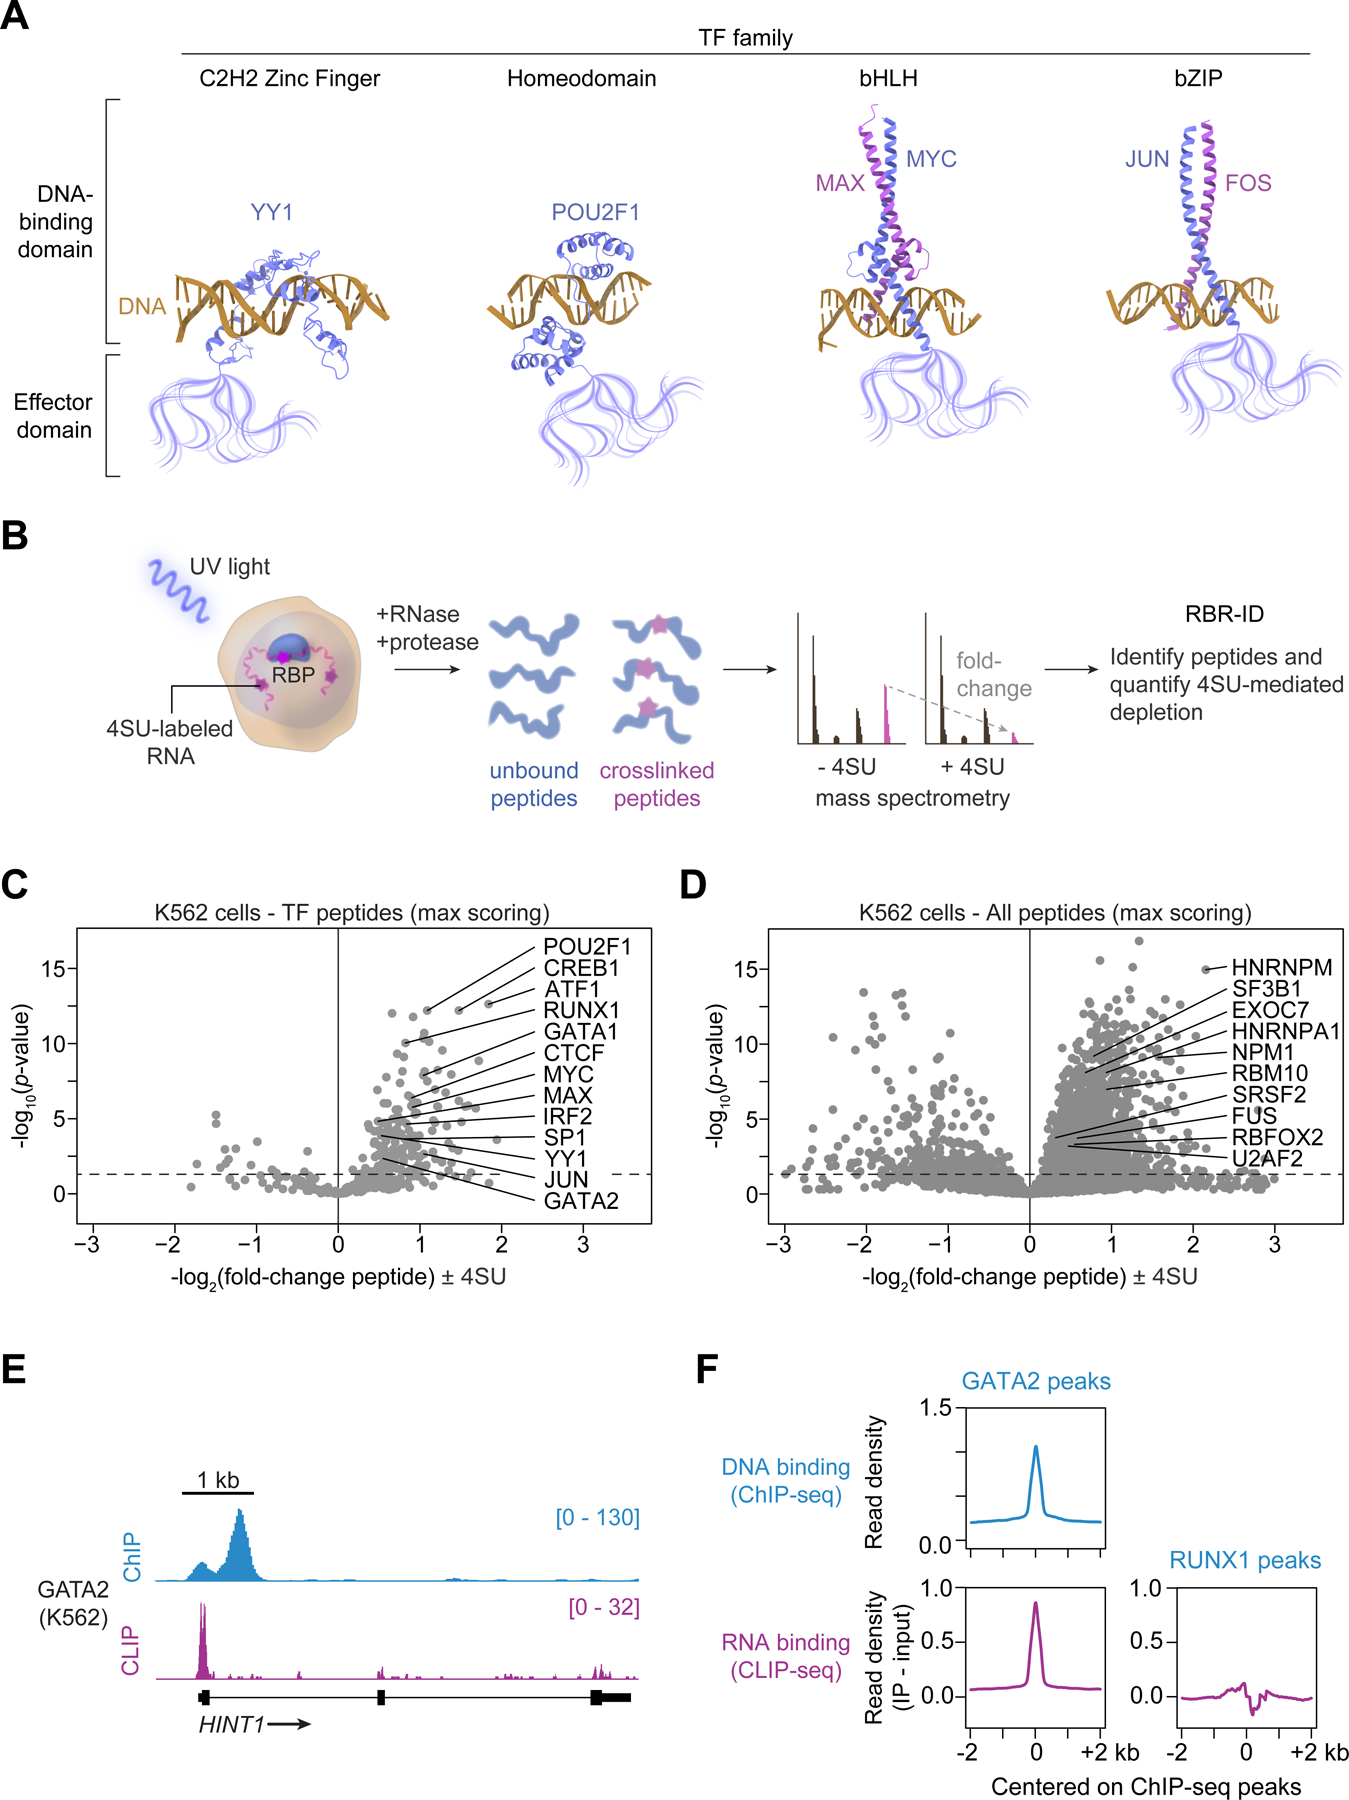
Figure 1. Transcription factor binding to RNA in cells.

(A) Schematic of DNA-binding and effector domains in transcription factors from different families (PDB accession numbers in Methods).
(B) Experimental scheme for RBR-ID in human K562 cells. 4SU-labeled RNAs are crosslinked to proteins with UV light. RNA-binding peptides are identified by comparing the levels of crosslinked and unbound peptides by mass spectrometry.
(C) Volcano plot of TF peptides in RBR-ID for human K562 cells with select highlighted TFs (dotted line at p=0.05). Each marker represents the peptide with maximum RBR-ID score for each protein.
(D) Volcano plot of all detected peptides in RBR-ID for human K562 cells with select highlighted RBPs (dotted line at p=0.05). Each marker represents the peptide with maximum RBR-ID score for each protein.
(E) ChIP-seq and CLIP signal for GATA2 at the HINT1 locus in K562 cells.
(F) Meta-gene analysis of input-subtracted CLIP signal centered on GATA2 or RUNX1 ChIP-seq peaks in K562 cells.
