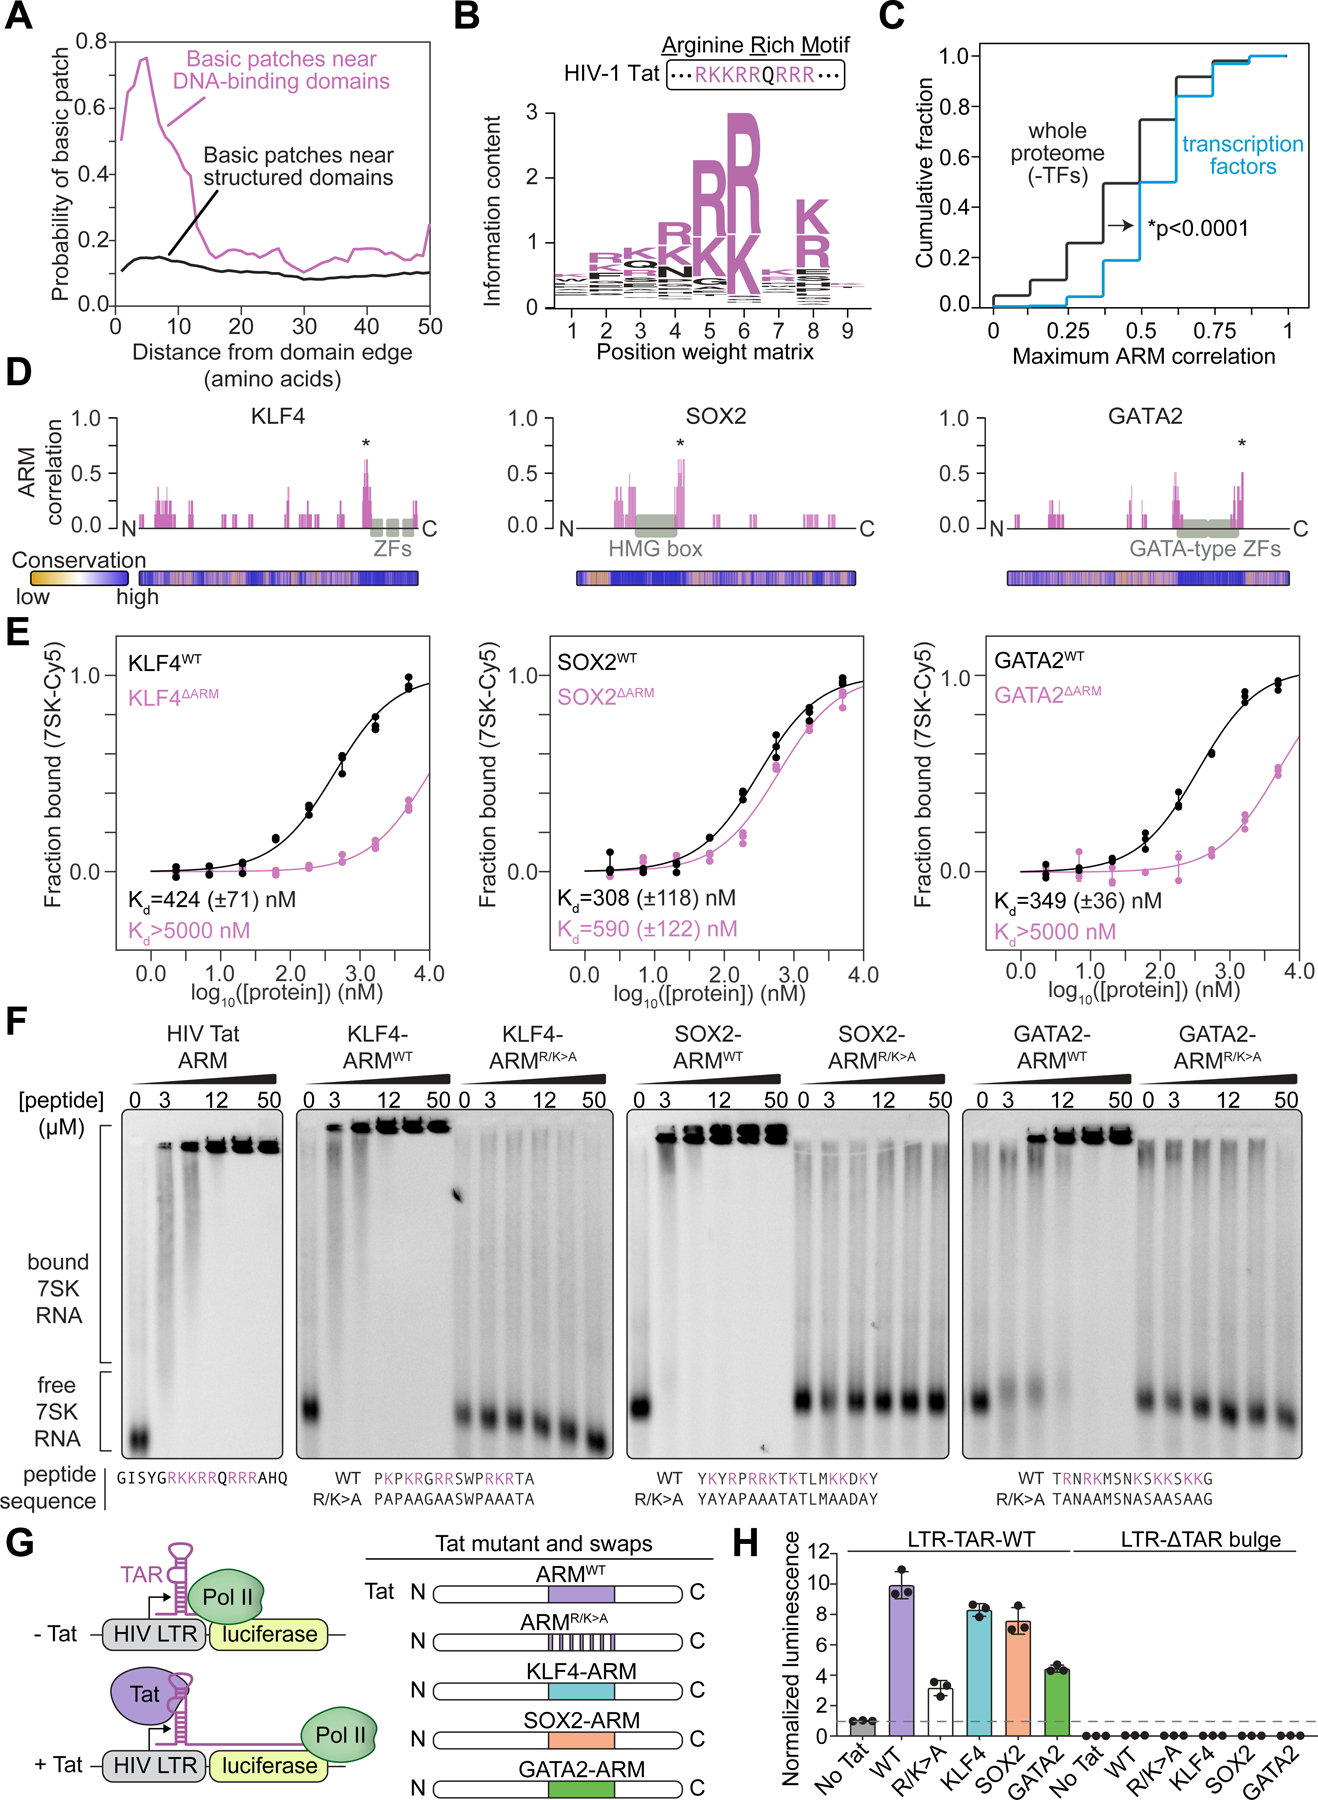
Figure 3. An arginine-rich domain in transcription factors.

(A) Plot depicting the probability of a basic patch as a function of the distance from either DNA-binding domains (magenta) or all other annotated structured domains (black).
(B) Sequence logo derived from a position-weight matrix generated from the basic patches of TFs.
(C) Cumulative distribution plot of maximum cross-correlation scores between proteins and the Tat ARM (*p < 0.0001, Mann Whitney U test) for the whole proteome excluding TFs (black line) or TFs alone (blue line).
(D) Diagram of select TFs and their cross-correlation to the Tat ARM across a sliding window (*maximum scoring ARM-like region). Evolutionary conservation as calculated by ConSurf (Methods) is provided as a heatmap below the protein diagram.
(E) Fraction bound RNA with increasing protein concentration for wildtype (WT) or deletion (ΔARM) TFs (KLF4 WT vs ΔARM: p=0.017; SOX2 WT vs ΔARM: p=0.0012; GATA2 WT vs ΔARM: p=0.018).
(F) Gel shift assay for 7SK RNA with synthesized peptides encoding wildtype or R/K>A mutations of TF-ARMs.
(G) Experimental scheme for Tat transactivation assay. RNA Pol II transcribes the luciferase gene in the presence of Tat protein and bulge-containing TAR RNA. Indicated TF-ARMs are tested for their ability to replace Tat ARM.
(H) Bar plots depicting the normalized luminescence values for the Tat transactivation assay with or without the TAR RNA bulge with the indicated TF-ARM replacements. Values are normalized to the control condition (padj<0.0001 for Tat RK>A compared to No Tat, WT Tat, KLF4, SOX2, and all conditions with TAR deletion; padj = 0.0086 for Tat RK>A compared to GATA2, Sidak multiple comparison test).
