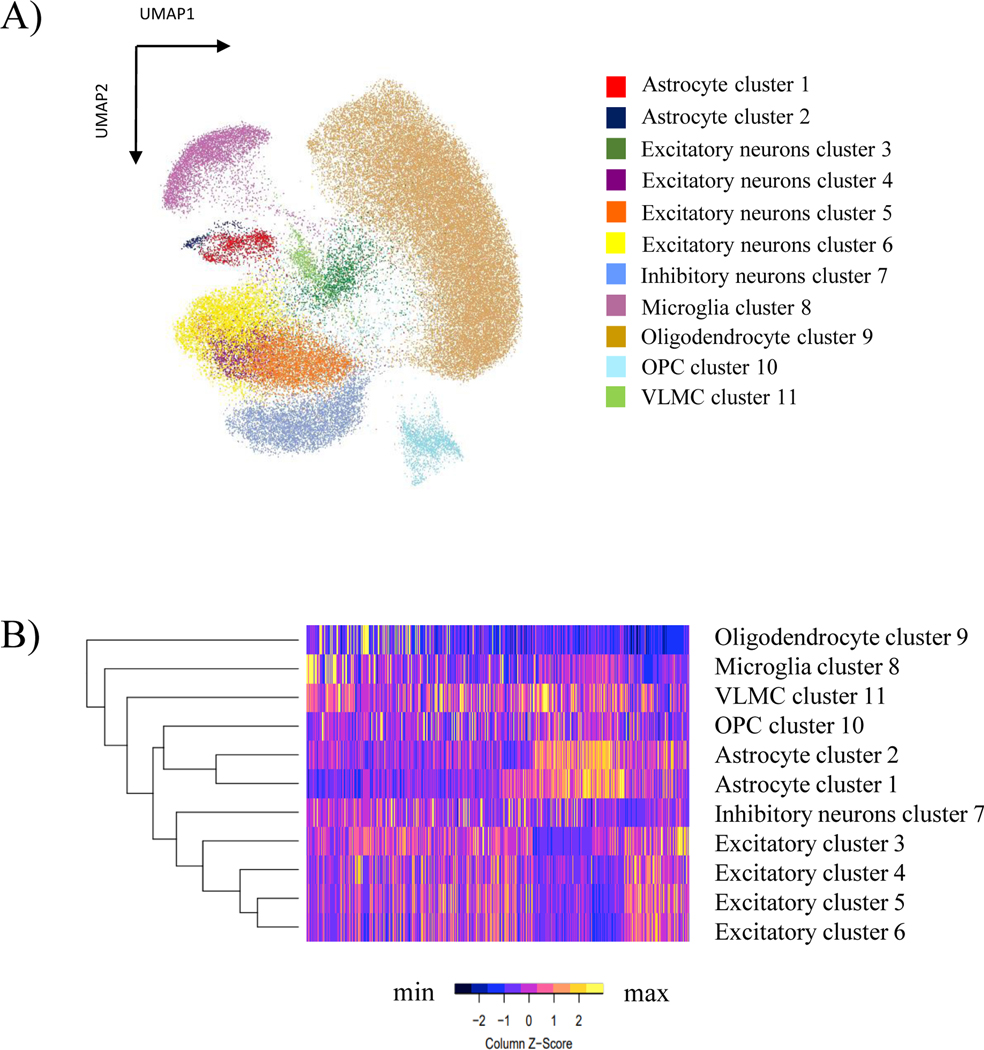
Figure 1. Visualization of the integrated single nuclei ATAC and RNA sequencing clusters and cell identification across the samples.

A) UMAP reduction plot using resolution of 0.4 resulting in 11 cell type clusters from the integration of snATAC-seq and snRNA-seq data. B) Heatmap showing cell cluster identification by chromatin accessibility patterns using the top 50 snATAC-Seq predicted gene scores for markers genes of the known cortex cell types.
