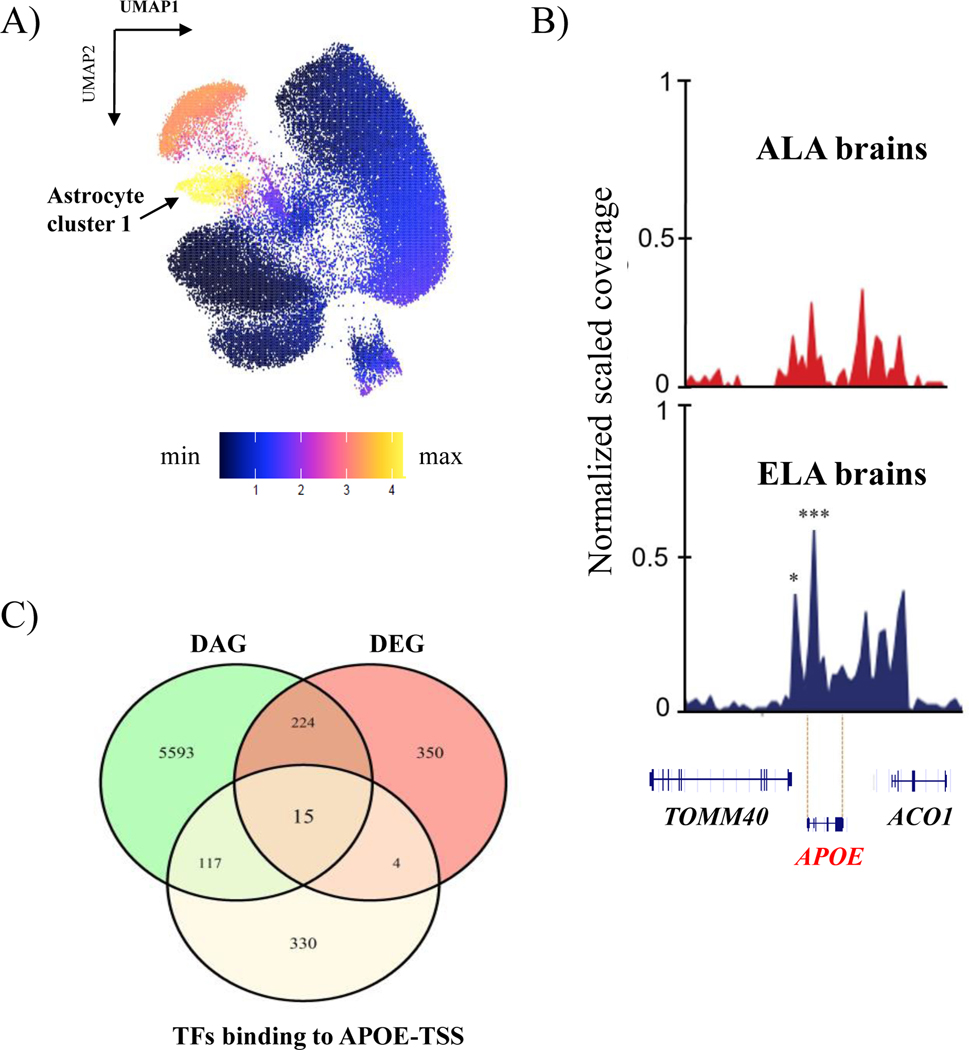
Figure 2. Differential chromatin accessibility and expression of APOE in Astrocyte cluster 1.
A) APOE expression represented in clusters generated by the integrated snATAC-seq and snRNA-seq data; B) Visualization of chromatin differential accessible peaks in the APOE locus between ancestries from Astrocyte cluster 1. *Represents significantly differentially accessible peaks between ancestries (*FDR=0.02; ***FDR=0.001). C) Venn diagram showing transcription factors biding to APOE that are differentially expressed (DEG) and differentially accessible (DAG).

