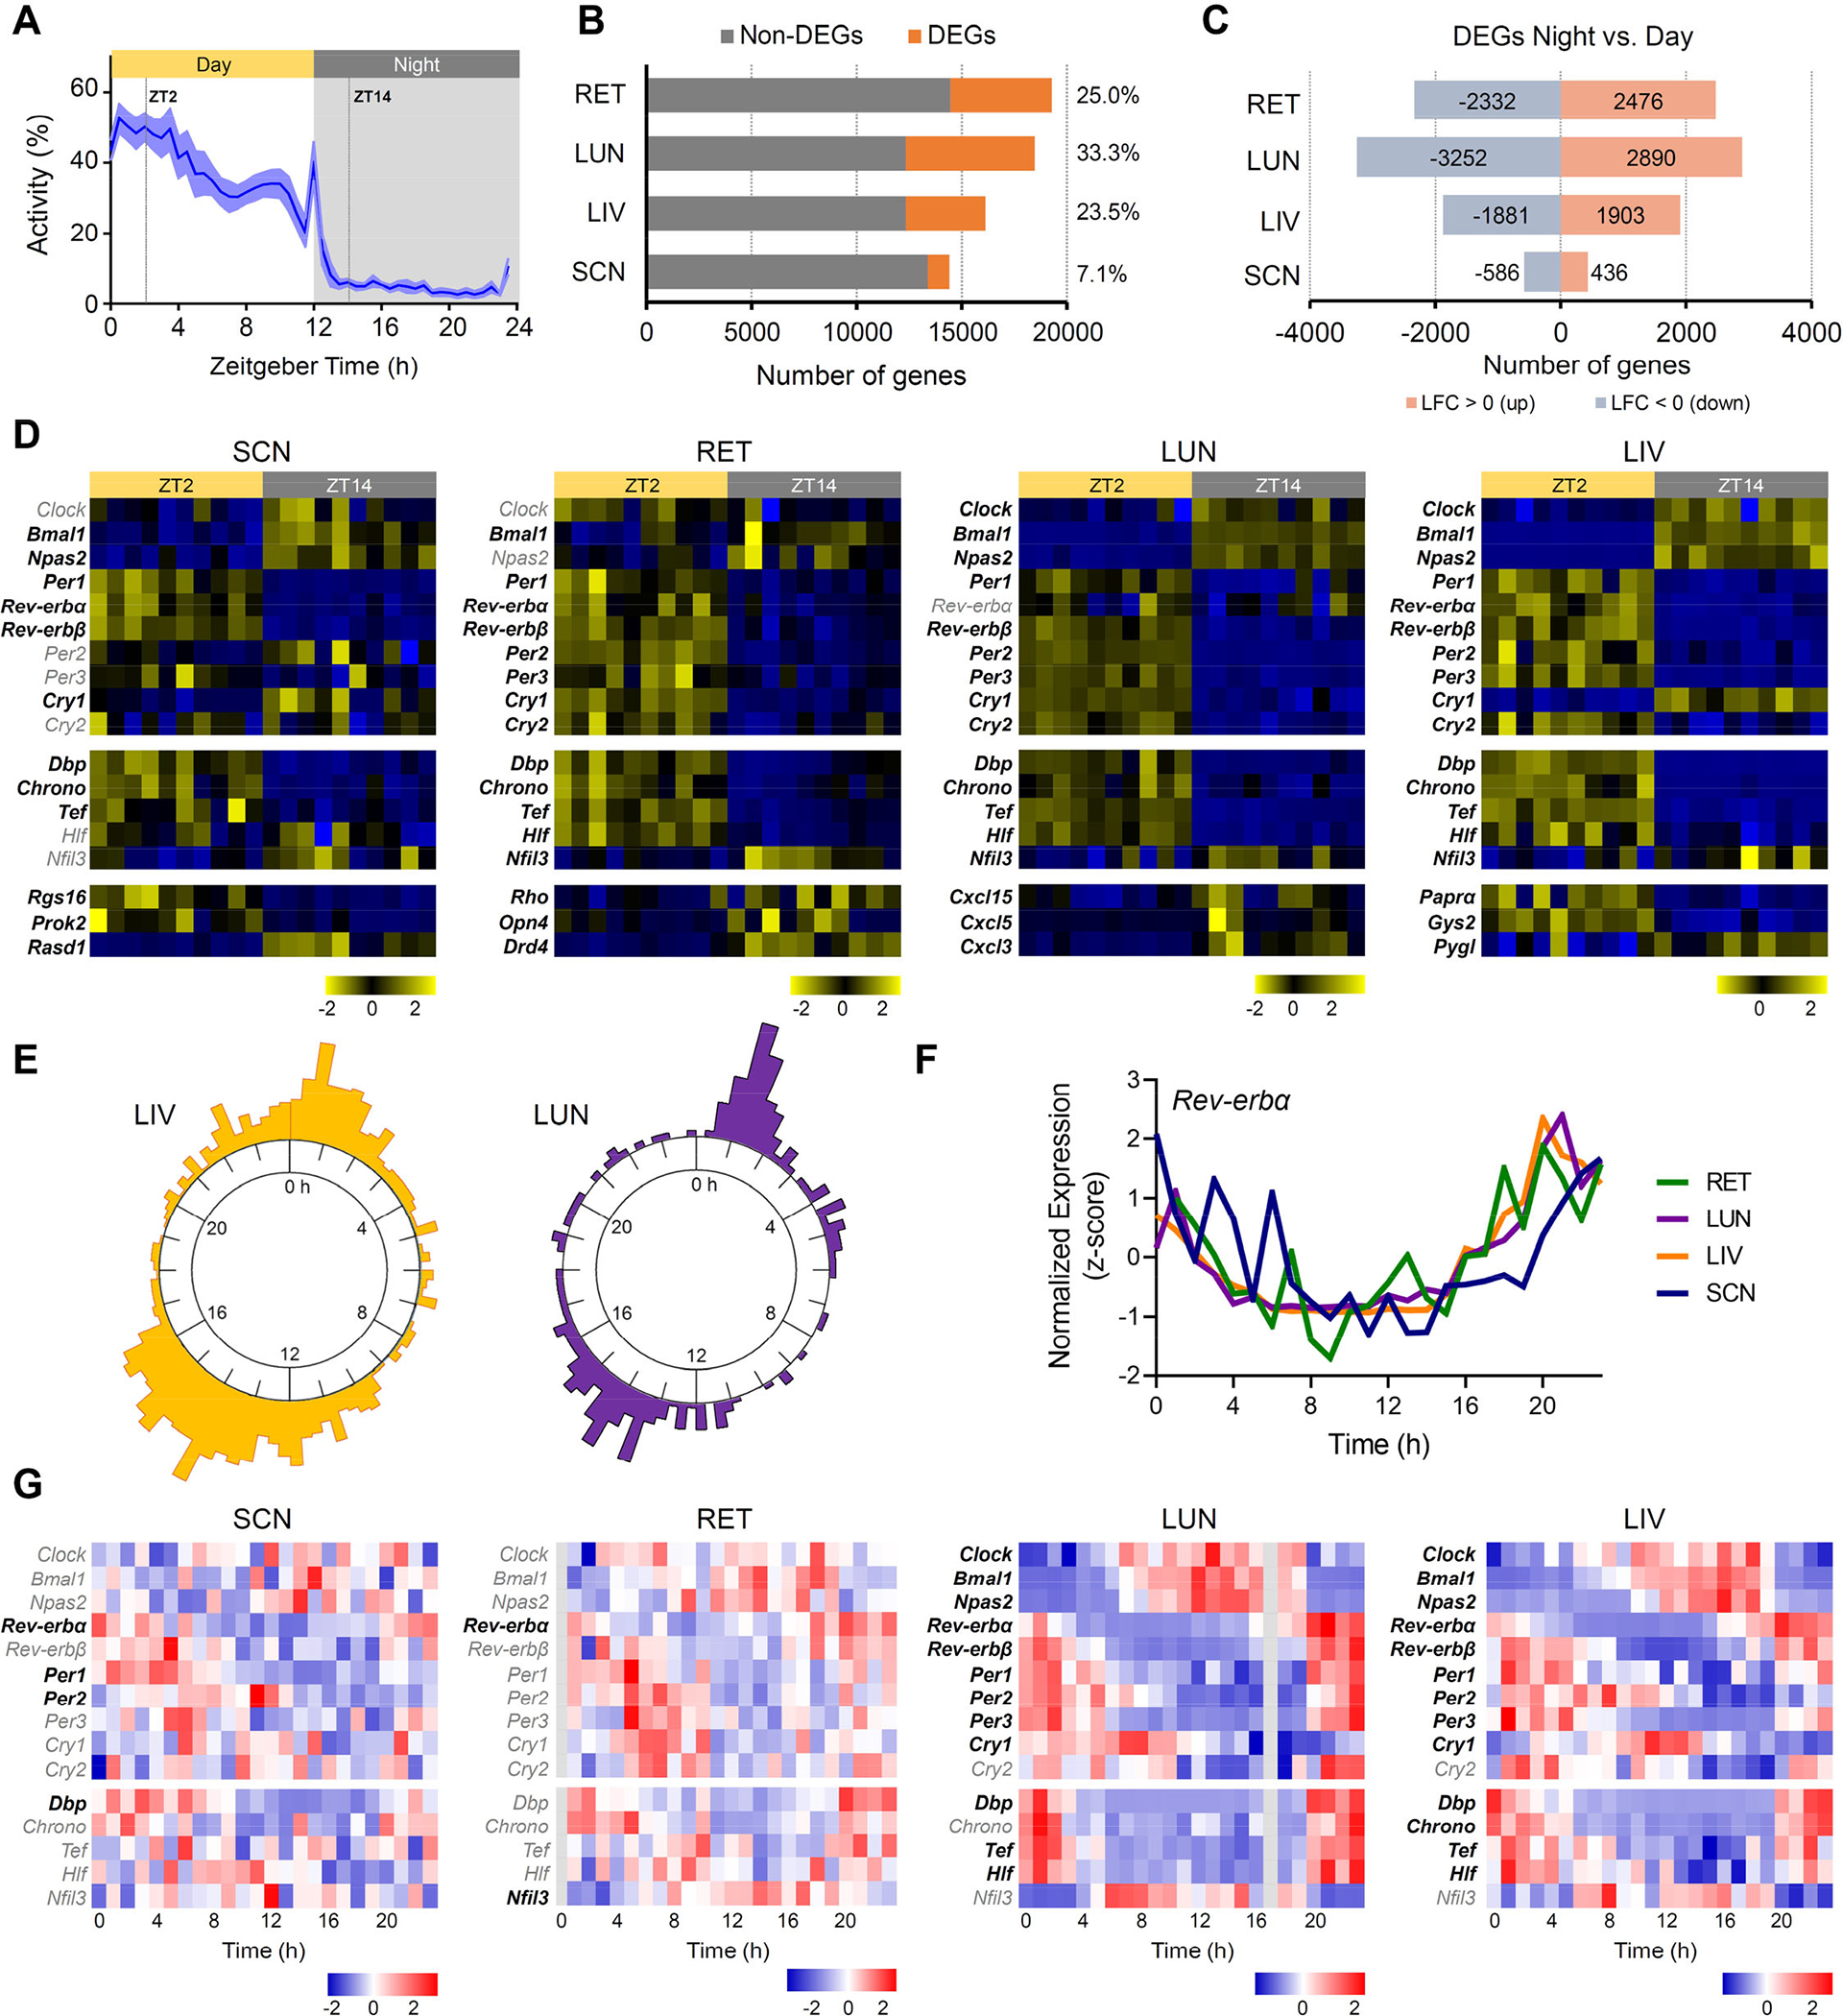
Figure 2. Rhythmicity of the diurnal African striped mouse transcriptome across central and peripheral tissues.

(A) Daily general activity pattern of striped mice under 12h light: 12h dark cycle. Values are expressed as mean ± SEM (n=10). Grey area indicates period of darkness. Zeitgeber time ZT0 corresponds to time of lights on. Dotted lines indicate timing of tissue collection during the day (ZT2) and at night (ZT14). (B) Number of day:night differentially expressed genes (DEGs; orange) and non-DGE (grey) across different tissues (retina (RET), lung (LUN), liver (LIV), and suprachiasmatic nucleus (SCN)). Numbers on the right indicate the percentage (%) of DEGs within each tissue. (C) Number of down- and up-regulated DEGsat night compared to daytime across tissues. Numbers of genes upregulated at night (log2 fold change (LFC>0) are indicated in orange and those downregulated (LFC<0) in blue. Only genes with an adjusted p-value below 0.05 were considered as DEGs. (D) Heatmaps showing expression levels (normalized values, z-score) for core clock genes (Clock, Bmal1, Npas2, Pers, Crys, Rev-erb, Chrono, Dpb, Tef, Hlf and Nfil3) and representative genes key for specific local-tissue function during the day (ZT2) and at night (ZT14). Squares across rows correspond to individual samples (n=10 day and n=10 night). Gene labels in black indicate DEGs. (E) Radial phase plot showing the distribution of times of peak expression relative to prior light:dark cycle (Time 0 = time of lights on) for genes that exhibited circadian rhythmicity in liver (left) and lung (right) under constant dark conditions (841 and 202 genes, respectively). (F) Circadian profile of Rev-erbα expression across the four tissues (Time 0 = clock time of lights on for prior light:dark cycle). (G) Heatmaps showing expression levels (normalized values, z-score) for core clock genes (Clock, Bmal1, Npas2, Pers, Crys, Rev-erb, Chrono, Dpb, Tef, Hlf and Nfil3) in SCN, RET, LIV and LUN collected over 24h in constant dark conditions (at 1h interval). Gene labels in bold indicate cycling genes with a BH.Q <0.1. Grey columns in the RET (Time 0h) and LUN (Time 17h) heatmaps represent missing data.
