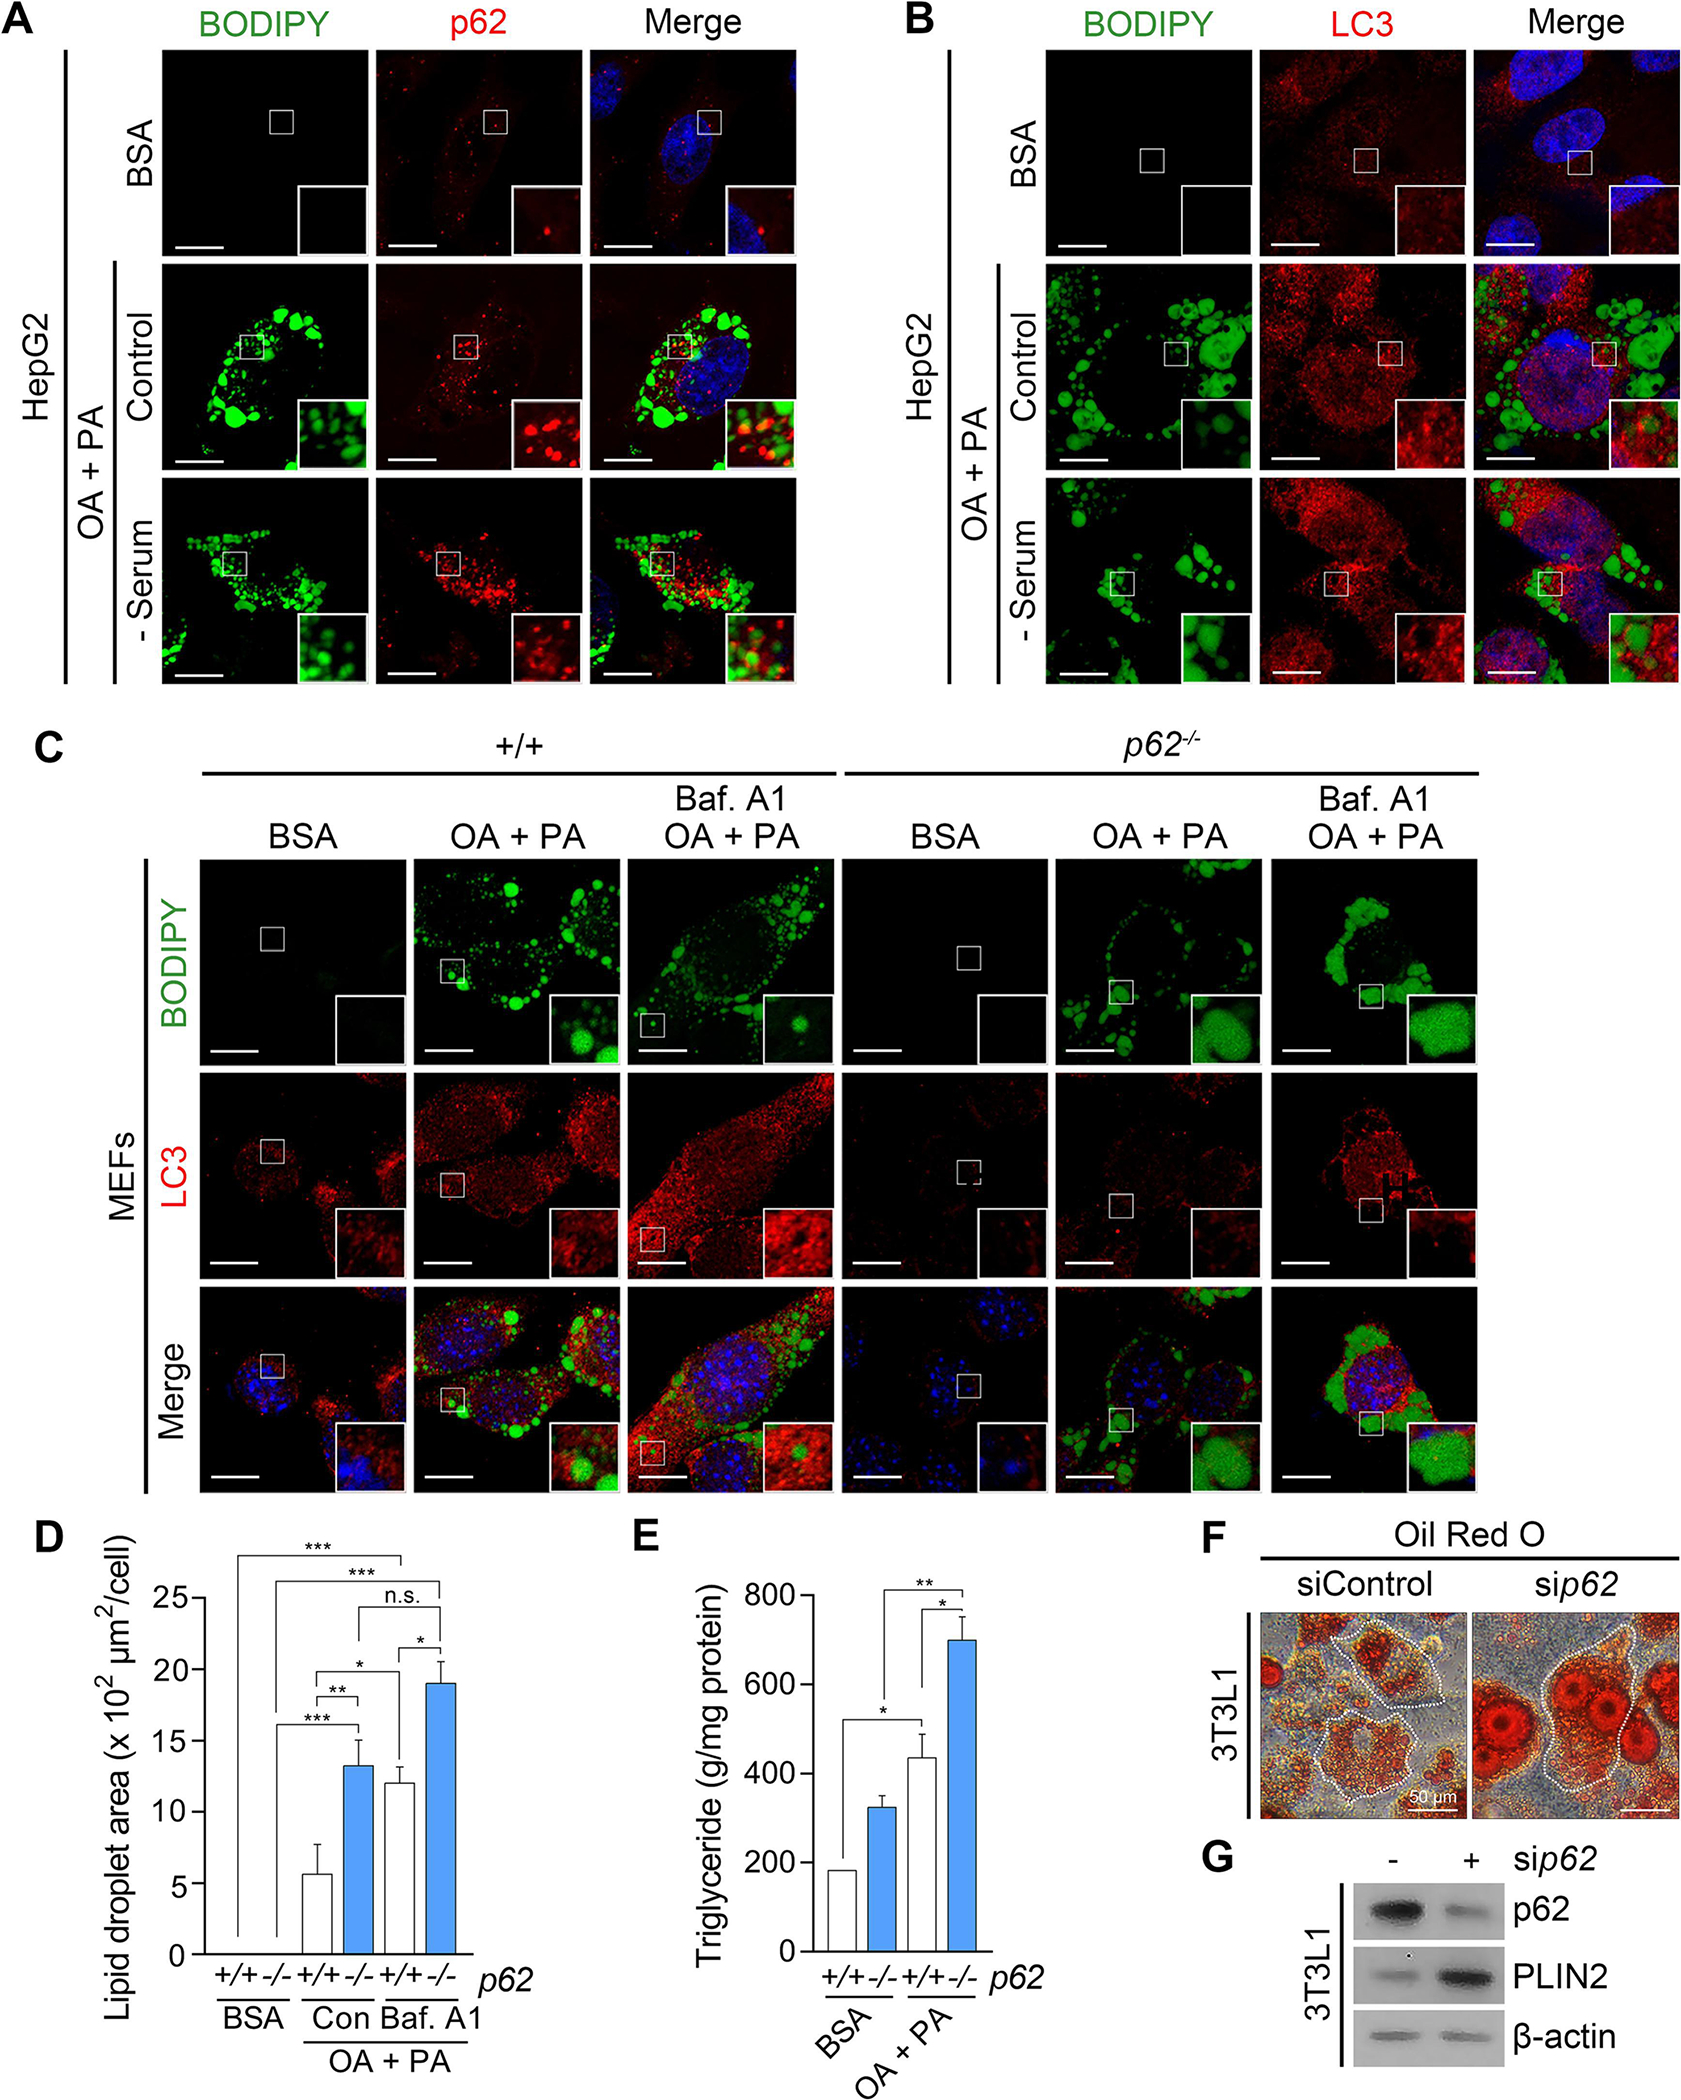
Fig. 1. p62 is required for autophagic degradation of lipid droplets.

(A) Immunocytochemistry (ICC) of p62 and BODIPY staining of lipid droplets (LDs) in HepG2 cells exposed to oleic acid (OA) (1 mM, 24 h) and palmitic acid (PA) (500 μM, 24 h) with or without sequential serum starvation (24 h). Scale bar, 10 μm. (B) ICC of LC3 and BODIPY signals in HepG2 cells exposed to OA/PA (1 mM/500 μM, 24 h) with or without sequential serum starvation. Scale bar, 10 μm. (C) ICC of LC3 and BODIPY signals in WT and p62−/− MEFs exposed to OA/PA (1 mM/500 μM, 24 h), with or without sequential treatment of bafilomycin A1 (Baf. A1) (200 nM, 4 h). Scale bar, 10 μm. (D) Quantification of LD area by ImageJ (n = 50 cells). (E) Enzyme-linked immunosorbent assay (ELISA) for triglyceride (TG) quantification (n = 4). (F) Oil Red O staining of 3T3L1 cells under siRNA-mediated knockdown of p62 (80 nM, 48 h). Scale bar, 50 μm. (G) Western blotting (WB) of 3T3L1 cells following RNA interference of p62 (80 nM, 48 h). *P < 0.05, **P < 0.01, ***P < 0.001, n.s., not significant.
