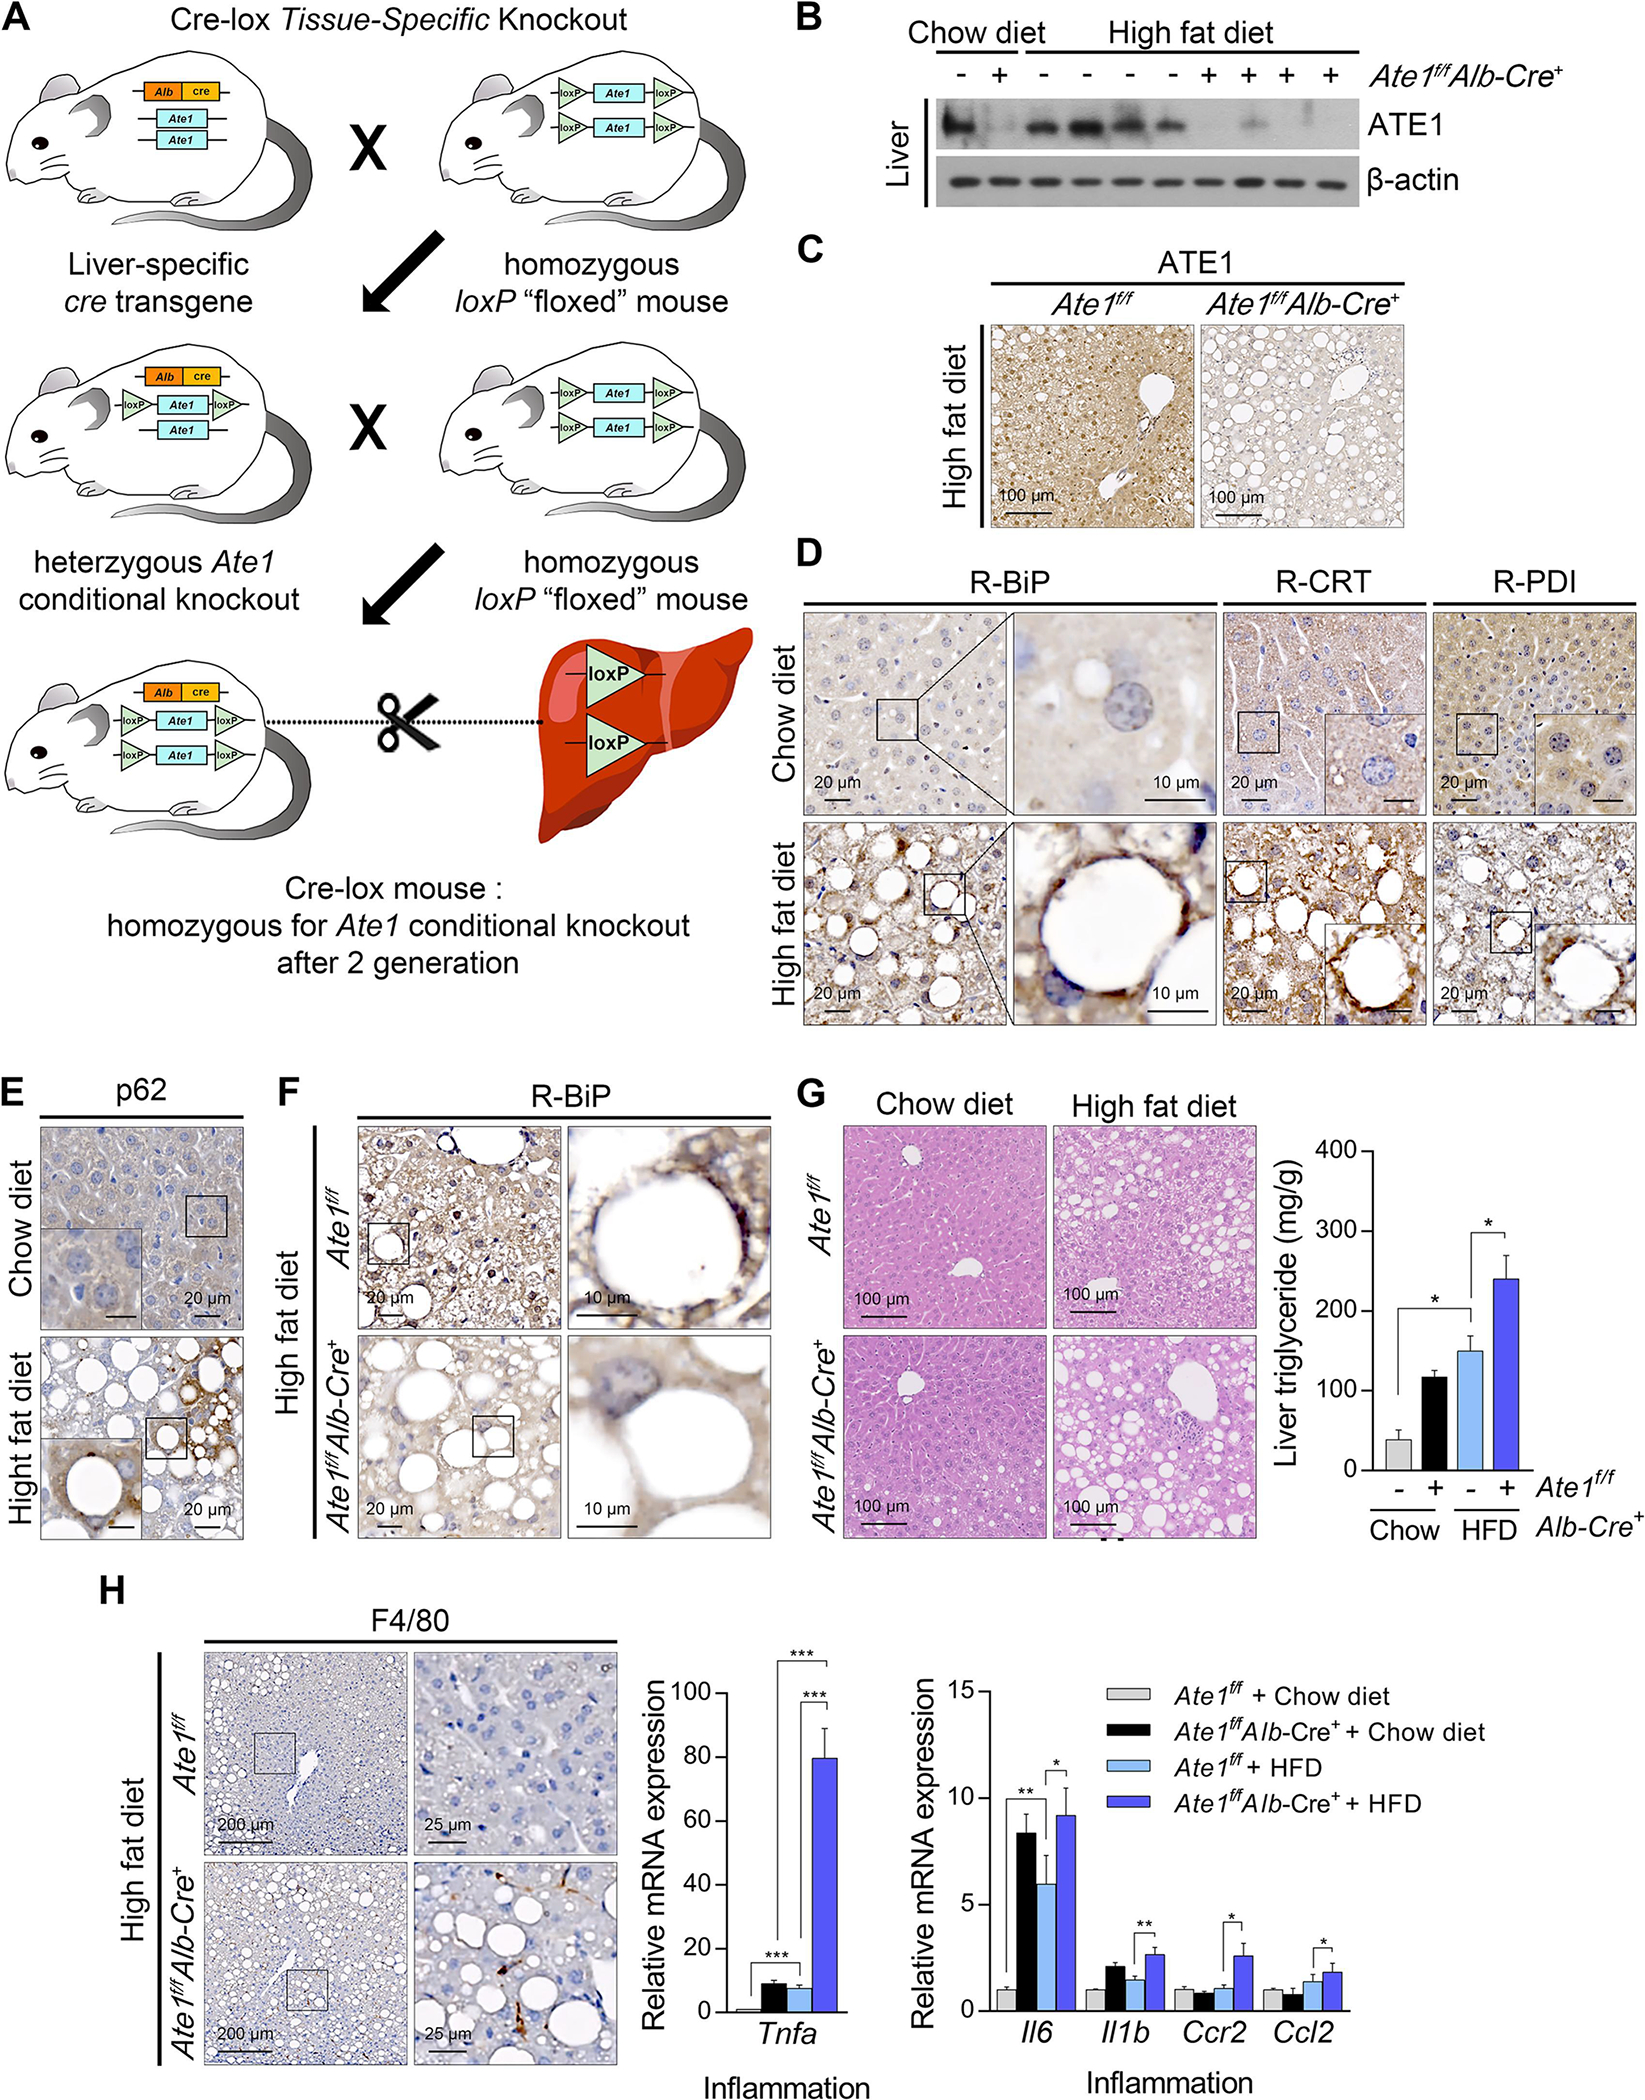
Fig. 4. Liver-specific Ate1 ablation aggravates non-alcoholic hepatosteatosis and its progression to steatohepatitis.

(A) Scheme of generating liver-specific Ate1 knockout mouse. Liver-specific Ate1 knockout mice and their littermate controls were fed with HFD (45% kcal fat) for 16 weeks. (B) WB and (C) IHC staining of hepatic ATE1 in liver-specific Ate1 knockout mice. Scale bars, 100 μm. IHC staining of hepatic (D) R-BiP, R-CRT, R-PDI, and (E) p62 upon HFD feeding. Scale bars, 20 μm or 10 μm (right column or inside box). (F) IHC staining of hepatic R-BiP in liver-specific Ate1 knockout mice. Scale bars, 20 μm (left column), 10 μm (right column). (G) Hematoxylin & eosin (H & E) staining (left panel) and TG quantification (right panel, n = 5) of liver-specific Ate1 knockout liver and their littermate control liver. Scale bars, 100 μm. (H) IHC staining of F4/80 (left panel) and mRNA levels of Tnfa (middle panel), Il6, Il1b, Ccr2, and Ccl2 (right panel) in liver-specific Ate1 knockout mice and their littermate controls. Scale bars, 200 μm (left column), 25 μm (right column). *P < 0.05, **P < 0.01, ***P < 0.001.
