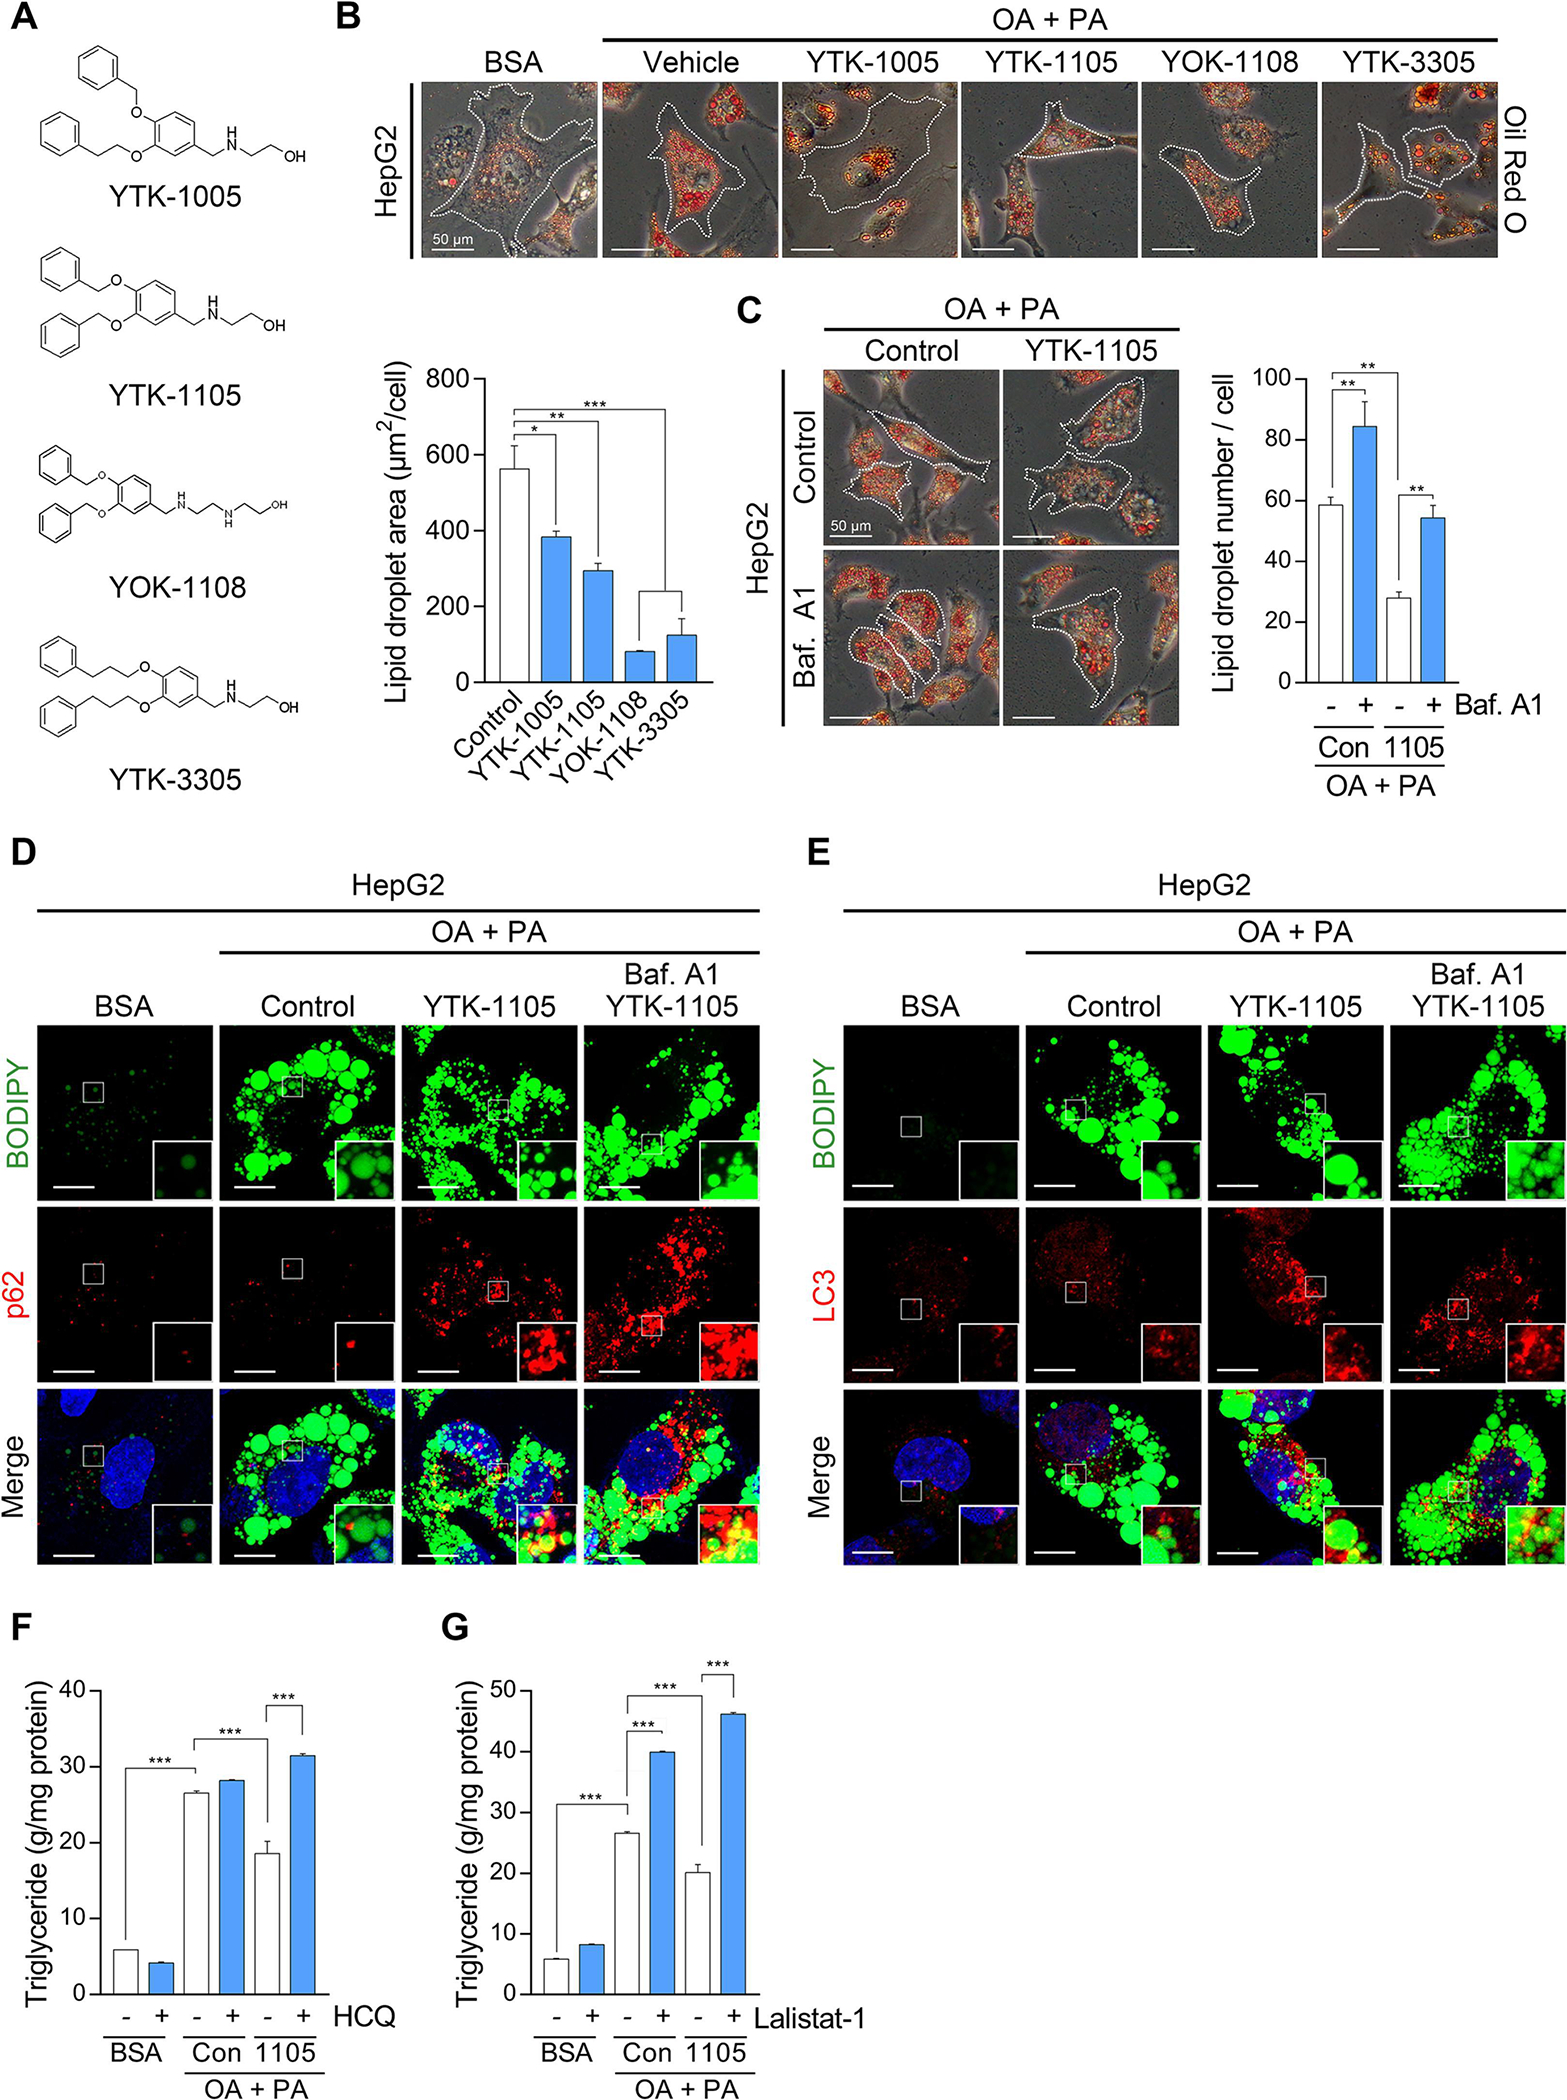
Fig. 5. Chemical mimicry of the N-degron Arg modulates lipophagy.

(A) Chemical structures of p62-ZZ ligands. (B) Oil Red O staining of fatty acid-loaded HepG2 cells treated with p62-ZZ ligands (5 μM, 24 h, upper panel) and quantification of LD area by ImageJ (n = 50 cells, lower panel). Scale bar, 50 μm. (C) Oil Red O staining of HepG2 cells treated with YTK-1105 (5 μM, 24 h), Baf. A1 (200 nM, 4 h), or both (left panel), and quantification of LD area (right panel, n = 50 cells). Scale bar, 50 μm. (D) ICC of p62 and BODIPY signals in HepG2 cells treated with YTK-1105 (5 μM, 24 h), Baf. A1 (200 nM, 4 h), or both. Scale bar, 10 μm. (E) ICC of LC3 and BODIPY signals in HepG2 cells treated with YTK-1105 (5 μM, 24 h), Baf. A1 (200 nM, 4 h), or both. Scale bar, 10 μm. TG quantification of HepG2 cells exposed to OA (600 μM, 24 h) and PA (300 μM, 24 h), with or without treatment of (F) hydroxychloroquine (HCQ, 25 μM, 18 h) or (G) Lalistat-1 (80 μM, 24 h). *P < 0.05, **P < 0.01, ***P < 0.001.
