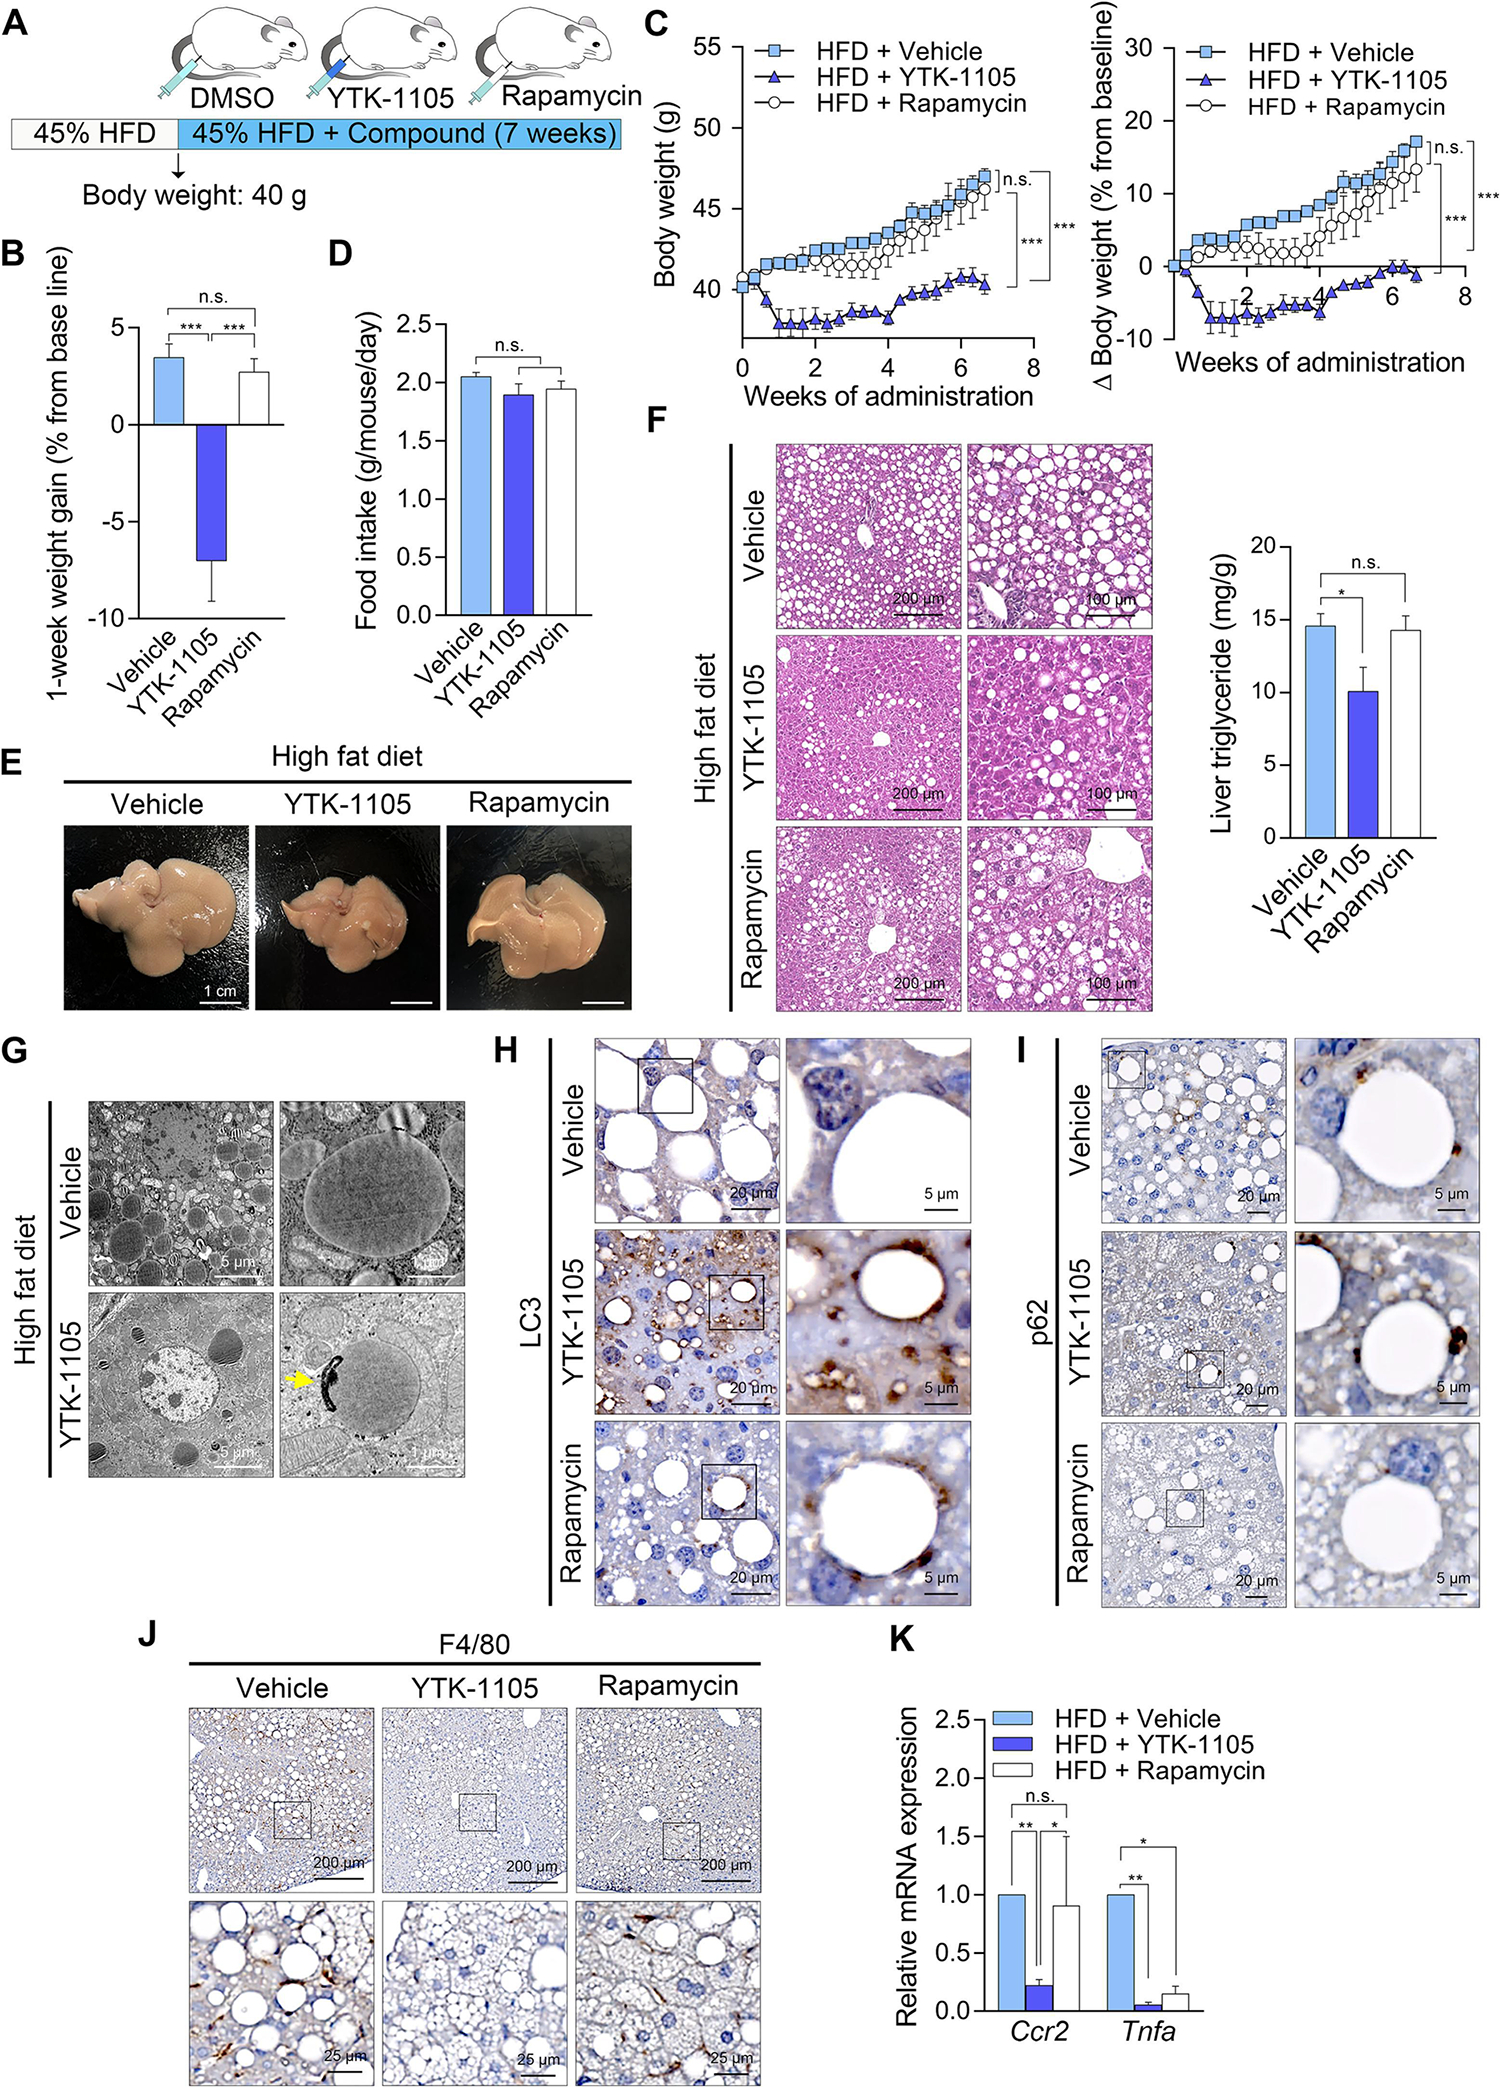
Fig. 9. YTK-1105, a p62-ZZ ligand, displays a stronger therapeutic efficacy in NAFLD and obesity compared with rapamycin, a bulk autophagy inducer, in diet-induced obese mice.

(A) Injection timeline and details of YTK-1105 and rapamycin in HFD-induced obese murine model. (B) Weight gain after 1 week of compound injection (n = 5). (C) Body weight changes during compound administration (left panel, n = 5). Percent body weight changes compared with baseline at the time of sacrifice (right panel, n = 5). (D) Food intake during compound administration (n = 5). (E) Gross morphology of compound treated livers. (F) H & E staining (left panel) and TG levels (right panel, n = 5) in liver treated with YTK-1105, rapamycin, or vehicle. Scale bars, 200 μm (left column), 100 μm (right column). (G) Transmission electron microscopy of liver treated YTK-1105 or vehicle. The autophagosome fused with a LD is indicated by a yellow arrow. Scale bar, 5 μm. IHC staining of (H) LC3 and (I) p62 in liver treated with YTK-1105, rapamycin, or vehicle. Scale bars, 20 μm (left column), 5 μm (right column). (J) IHC staining of F4/80 and (K) mRNA levels of Ccr2 and Tnfa (right panel, n = 5) in liver treated with YTK-1105, rapamycin, or vehicle. Scale bars, 200 μm (upper row), 25 μm (lower row). *P < 0.05, **P < 0.01, ***P < 0.001, n.s., not significant.
