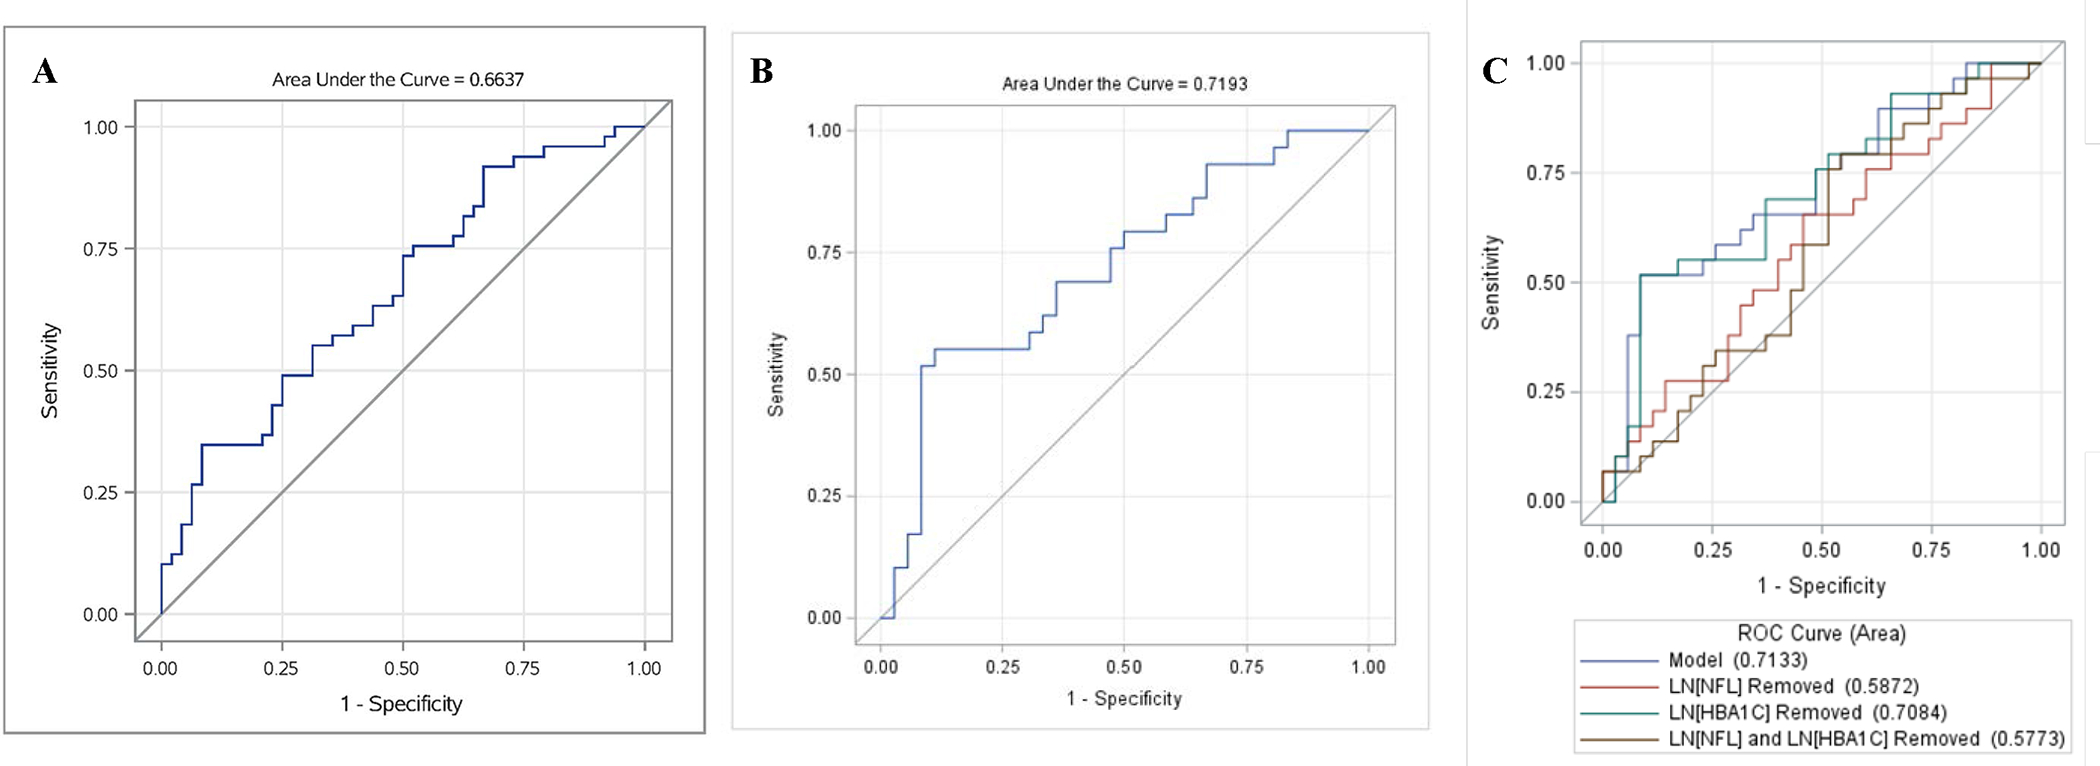
Figure 2:

Predicting DN status using plasma neurofilament light chain concentrations (NFL)
Panel A = Cross-sectional predictive value of NFL at Assessment 4. Receiver operating characteristic (ROC) curve of DN at Assessment 4 with value of LN[NFL] and gender, age, Type 2 diabetes duration and BMI as explanatory variables. Cross sectional NFL concentrations show modest predictive power for DN status.
Panel B = Predictive value of NFL at Assessment 2 on future DN status. ROC for logistic regression model for DN status (Assessment 4), using LN[NFL], sex, age, duration, and BMI all at Assessment 2 for participants MNSIE <= 2). NFL concentrations at Assessment 2 show moderate predictive power for future DN status.
Panel C = Marginal contributions of NFL and HbA1C individually and combined to the predictive power of NFL at Assessment 2 on future DN status. ROC for logistic regression model for DN status (Assessment 4), using LN[NFL], LN[HbA1C], sex, age, duration, and BMI all at Assessment 2 for participants with MNSIE <= 2. NFL contributes more substantially to the predictive power of DN than HbA1C.
