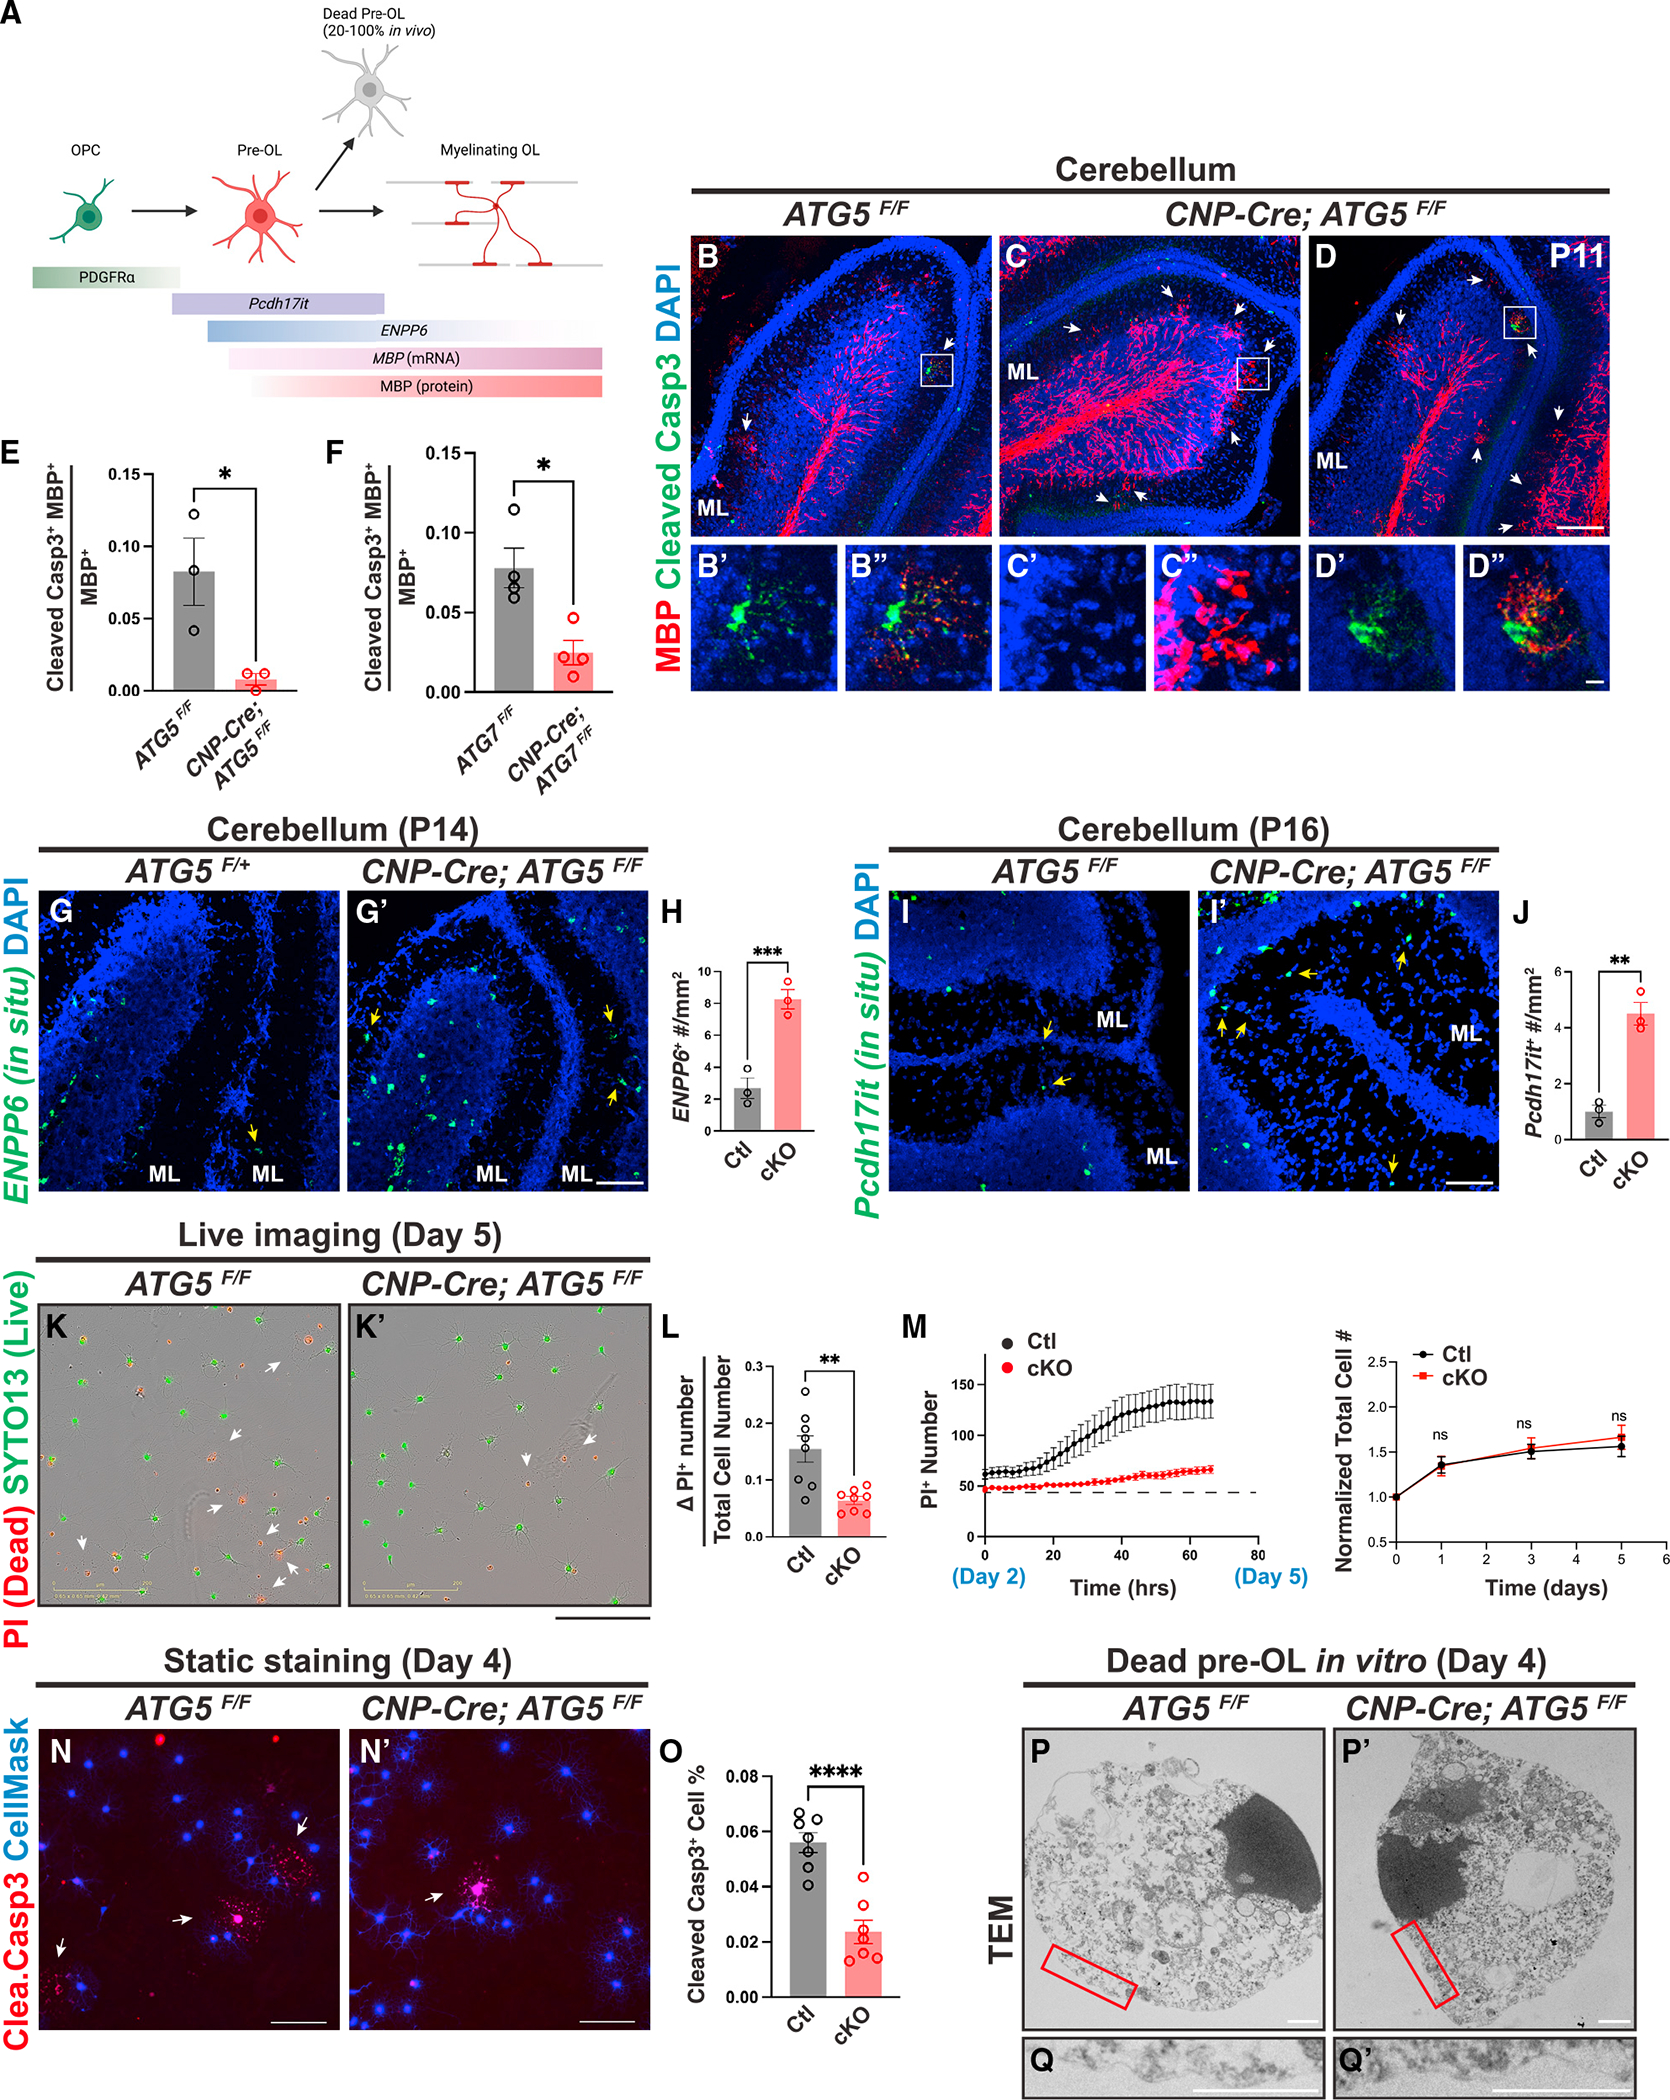
Figure 4. Autophagy functions cell autonomously to promote pre-OL apoptosis.

(A) Diagram showing OL differentiation and the markers that delineate OPC, pre-OLs, and myelinating OLs (modified from Kasuga et al.24 and created by BioRender).
(B–D″) Representative confocal micrographs of P11 cerebella from ATG5F/F (B–B″) and CNP-Cre; ATG5F/F (C–D″) stained by MBP (red) and cleaved caspase-3 (green) antibodies. (B′) and (B″), (C′) and (C″), and (D′) and (D″) represent the insets in (B), (C), and (D), respectively. White arrows indicate transiently differentiated pre-OLs in the cerebellar ML at P11.
(E and F) Quantification of the ratio of MBP+ cleaved caspase-3+ double-positive cells over total MBP+ cells in the cerebellar ML from P11 ATG5 cKO (E) and P10 ATG7 cKO (F) mice.
(G and H) In situ hybridization using the ENPP6 probes (G and G′) and quantification (H) showing that CNP-Cre; ATG5F/F mutants exhibited increased ENPP6+ cells in the cerebellar ML at P14 (yellow arrows in G and G′).
(I, I′, and J) In situ hybridization using the Pcdh17it probes (I and I′) and quantification (J) showing that CNP-Cre; ATG5F/F mutants exhibited increased Pcdh17it+ cells in the cerebellar ML at P16 (yellow arrows in I and I′).
(K and K′) Representative live-cell imaging micrographs of ATG5F/F (K) and CNP-Cre; ATG5F/F (K′) OLs at differentiation day 5 labeled by propidium iodide (PI; red for dead cells) and SYTO13 (green for live cells).
(L) Quantification of the increased PI+ cell number from day 2 to 5 (ΔPI+ number, reflecting pre-OL cell death) to the total cell number at day 5.
(M) Left: representative curves of PI+ cell number from differentiation day 2 (before pre-OL stage) to 5 (after pre-OL stage). Right: normalized total cell number (including live and dead cells) between control and ATG5 cKO OLs during in vitro differentiation.
(N and N′) Representative micrographs of ATG5F/F (N) and CNP-Cre; ATG5F/F OLs (N′) showing cleaved caspase-3+ cells (red) at differentiation day 4.
(O) Quantification of cleaved caspase-3+ cell percentage at differentiation day 4.
(P–Q′) Representative TEM micrographs of ATG5F/F (P and Q; n = 31 cells) and CNP-Cre; ATG5F/F OLs (P′ and Q′; n = 15 cells) at differentiation day 4. (Q) and (Q′) represent the red insets in (P) and (P′), respectively.
Error bars represent SEM. Scale bars: 100 μm in (D) for (B)–(D); 10 μm in (D″) for (B′)–(D′); 100 μm in (G) for (G) and (G′); 100 μm in (I′) for (I) and (I′); 200 μm in (K′) for (K) and (K′); 100 μm in (N) and (N′); and 1 μm in (P)–(Q′). Open circles in (E), (F), (H), and (J) represent individual animals; n ≥ 3 animals per category. n = 8 wells (L and M) and n = 7 coverslips (O) from 3 separate OPC purifications. Two-tailed t tests for (E), (F), (H), (J), (L), (M), and (O). *p < 0.05, **p < 0.01, ***p < 0.001, ****p < 0.0001, ns, not significant.
